Real-time GOM storm tracking estimates production loss
Scott Morris
Tony Dupont
Syeda H. Zaidi
John D. Grace
Earth Science Associates, Inc.
Long Beach, Calif.
Tropical cyclones pose a great risk to human life and cause massive disruptions to hydrocarbon production in the Gulf of Mexico (GOM). The National Hurricane Center (NHC) produces forecasts for the position and intensity of tropical cyclones but focuses warnings on landfall.1 To determine if or when evacuations need to take place offshore, a cyclone impact tool has been developed to process the NHC forecast data in real time to determine wind speeds at every platform in the Gulf of Mexico (GOM). These wind speeds generate platform production loss forecasts associated with the cyclone. The wind speeds and production forecasts are updated coincident with each NHC forecast and are accessible through a web browser.
Data acquisition
The NHC maintains a tropical cyclone database which includes location and intensity information for every 6 hr dating back to 1851 (although much of the older data are incomplete). It designates this database HURDAT2 (HURicane DATa 2nd generation) and the version used for this model was complete through the 2022 hurricane season. While the NHC has had location and intensity data since 1851, in 2004 it began recording much more detailed wind speed information which is crucial to calculate accurate wind speeds at platforms. Data used for this system, therefore, include all HURDAT2 Atlantic tropical cyclones from 2004 to 2022.
Additional data in HURDAT2, starting in 2004, contain radii in four quadrants (NE, NW, SW, SE) of maximum distance for wind speeds at thresholds of 34, 50, and 64 knots (1 knot = 1.15 miles/hr). Maximum wind speed at the center of the cyclone, along with the wind radii data, determines the actual wind speeds sustained at each of the platforms in the GOM.
Platform production provides the other data needed for the tool. These data come from Earth Science Associates’ GOM3 system. This dataset provides monthly platform production in bbl for oil and Mcf for gas.
Platform wind speeds
NHC maintains records for cyclone wind speed, but this system needs wind speeds at the platforms which vary over distance and direction from the cyclone. Historical data supports model verification while a program automatically checks the NHC website for real-time data to use in updates and wind speed processing. Additionally, an interpolation code fine-tunes windspeeds at specific platform locations.
The program checks the NHC’s RSS feed every 10 minutes for updates to their forecast advisories. The forecast advisory produces a text page containing the most up-to-date information on the cyclone’s location and the same radii information as supplied in HURDAT2. Keywords parse the forecast advisory to convert the text page into a usable table, formatted identically to HURDAT2. This formatting process allows identical processing between real-time wind speed data and historical wind speed data.
Wind speed data are first time-based interpolated because HURDAT2 and real-time data typically occur in 6-hr increments. Without interpolation, a cyclone having a 15-mph ground speed will move 90 miles between NHC forecast locations, resulting in missing wind speed data at platforms lying in waters between these wind reports. A simple linear interpolation produces adjusted hourly maximum wind speeds and wind speed radii.
For example, the table shows raw data from the HURDAT2 for hurricane Alex for hours 1200 and 1800. The bold row shows interpolated data for hour 1500. Radii distances are only shown for the 34-knot threshold, but the process is the same for 50- and 64-knot thresholds. Interpolation is performed for every hour of missing data.
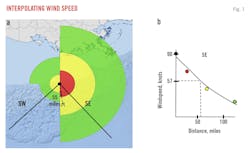
A second interpolation determines wind speed data within each quadrant. An exponential curve is fit to the wind speeds versus distance from the center of the cyclone (Fig. 1). Four datapoints fit hurricane force winds. These points include 0 radius (location of maximum wind speed), 34-knot radius, 50-knot radius, and 64-knot radius. If there are only storm force winds (at least 34 knots but less than 64 knots), a simple linear fit uses only two or three data points.
Fig. 1a shows a map with the 34- knot (green), 50- knot (yellow), and 64- knot (red) radii for 1 hr of cyclone data. An example platform lies 55 miles from the center of the cyclone in the southeast quadrant. Figure 1b shows the max wind speed as a black dot and the radii data plotted using corresponding colors with an interpolated exponential curve drawn in black. The dashed lines show how the interpolation assigns 57 knots to the platform using the southeast radii.
Finally, since platforms are not directly in the center of the quadrants, a weighted average of the two nearest quadrants calculates wind speed at a platform. The platform in Figure 1a uses the SW and SE quadrants. Figure 1b shows that the southeast quadrant calculates a wind speed of 57 knots and the southwest quadrant calculates a wind speed of 30 knots (not shown). Using the angle from the center of the cyclone to the platform results in 55-45 southeast-southwest weighting and 57(0.55) + 30(0.45) = 44.85 knots calculated wind speed. Modeling uses a windspeed dataset comprised of this calculation for every cyclone for every hour for every platform in the NHC database. Real-time data undergo the same process and are provided to the forecasting system.
Platform production loss
Accurate production loss prediction from cyclones requires current platform production. Both historical production data and real-time data are required. Earth Science Associates’ GOM3 system provides historical data. The time between operator-reported production and public data-release is several months. Individual operators can use their own data in real time, but publicly available data are required for a multi-operator, GOM-wide analysis. Production generally does not change rapidly at platforms, thus rolling averages provide general GOM-wide production data.
Statistical model
The underlying physics assumes that greater wind speeds and longer durations (wind force) result in greater production losses. An integral of the windspeed vs. time, calculated for every platform, determines total wind force (Fig. 4). Additional calculations separate total wind force of at least 34-knot wind-speeds and the total wind force of at least 64-knot wind-speeds.
Production loss represents the difference in production before and after the storm using a 3-month production average before the storm and forecasted total production the month of and 2 months following the storm. Restricted production more than 2 months after a hurricane, such as a destroyed platform, are rare and not considered.
Cyclones occurring in consecutive months make it difficult to assign historical production losses to one cyclone versus the other. This situation does not occur very often (Katrina and Rita provide a prime example), but in such cases production losses were split proportionally to wind force and weighted toward the most recent cyclone.
Initial modeling experiments used individual platform wind speeds and production losses for every cyclone in the dataset, but this proved problematic due to variability of platform restarts which were attributed to logistics rather than hurricane damage. To smooth this variability, a GOM-wide model incorporated every month which had a cyclone of at least storm-force winds, providing 21 data points of storm force winds and 12 data points of >64-knot hurricane force winds. Fig. 2 shows this data where large red circles are hurricanes drawn proportionally in size to total wind force, and the small brown squares are storms.
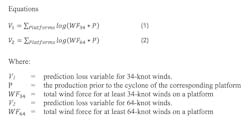
The GOM-wide model calculates data at the platforms and aggregates them to the entire GOM. Linear regression uses Equations 1 and 2 production loss coefficients for 34- and 64-knot winds, respectively. The product of wind force x production produces a primary variable for predictive loss, and if a platform has none of either then predicted losses are zero. Multiplying the total 34 or 64 knot wind force by production before the storm produces this production-weighted wind force variable, and summing up the logarithmic values of these weighted forces produces one observation of data per month with a storm or hurricane. Separate regression models for oil and gas produced R2 values near 0.9.
Fig. 3 shows predicted oil-production loss versus actual oil-production loss. The red line represents a perfect forecast. Circles above the line indicate months with cyclones that the model overpredicted lost production and circles below the line indicates there were more production losses than the model predicted.
Fig. 4 shows a wind speed forecast using the real-time program for Shell’s Perdido platform. The plot reports dangerous wind speeds in more time-based granularity than available in the raw NHC data. These plots can aid in platform safety and are available for specific platforms on the web. The most updated data are always shown. No software is needed except an internet browser.
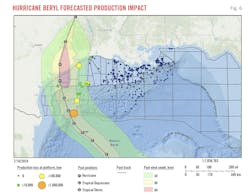
Calculations occur on a server far from any disruptions happening locally due to the storm. Users simply select to view a report or map. Reports are available for the entire GOM or for specific operators and can be viewed over time or per cyclone. The report shown in Fig. 5 is current as of July 2024 but is updated as new cyclones pass through the GOM. The map allows users to select individual platforms affected by the current storm to get more information including the windspeed plots and production losses forecast (Fig. 6).
References
- US National Hurricane Center, National Oceanic and Atmospheric Administration, Jan. 16, 2024.
Authors
Scott Morris ([email protected]) is a mathematician at Earth Science Associates, Long Beach, Calif. He holds an MS (2012) in applied mathematics from California State University, Fullerton.
Tony Dupont ([email protected]) is chief operating officer of Earth Science Associates, Long Beach, Calif. He holds an MA (2009) in geography from California State University, Fullerton.
Syeda H. Zaidi ([email protected] is lead full stack developer for Earth Science Associates. She earned a BS (2011) and MBA (2017) from the University of Karachi, Pakistan followed by a coding certification from UCLA.
John D. Grace ([email protected]) is president of Earth Science Associates, Long Beach, Calif. He holds a PhD (1984) in economics from Louisiana State University. He is a member of the Society of Exploration Geophysicists, Society of Petroleum Engineers, and the International Association for Mathematical Geosciences.


