Approach assesses waterflooding benefits in Egyptian oil field
Mahmoud Abu El Ela
Cairo University
Giza, Egypt
A complete and comprehensive reservoir management approach showed the benefits of waterflooding Ferdous field in the North Bahariya concession of Egypt's Western Desert.
The field is about 130 km west of Cairo and operated by North Bahariya Petroleum Co., a national joint venture company.
A pilot waterflood in the field started in August 2010.
The waterflood study concluded that the Upper Bahariya formation is a vertically isolated-stratified reservoir with five units. The main producing units of the Upper Bahariya are UB-2 and UB-3. These units have the estimated potential of recovering an additional 2 million bbl of oil under a full-scale waterflood.
Estimated original oil in place (OOIP) is about 5 million bbl in UB-2 and about 11.9 million bbl in UB-3.
Ferdaus field
An exploration and development plan for Ferdaus field was carried out during 2004-07.
The field produces oil with 41-43° gravity from sandstone reservoirs in the Cretaceous Abu Rawash G and Upper Bahariya formations.
The earliest development plan included six producing wells in the Upper Bahariya formation: F-1, F-5, F-7, F-9, F-15, and F-16ST2. These wells produced more than 2,500 bo/d.
At the start of the waterflood study, the daily production rate had decreased to less than 600 bo/d.
Reservoir management
Reservoir management is an ongoing, dynamic process of collecting, analyzing, validating, and integrating reservoir description data and performance data into an optimal reservoir development and depletion plan.1-4 It can also be defined as an efficient use of resources for decision making on the basis of facts, information, and knowledge in order to achieve the maximum hydrocarbon recovery at the lowest cost, while protecting the environment and people's health, and maintaining harmony with society.
Making smart decision depends on the ability to analyze and integrate the available data from the disciplines of geology, geophysics, and reservoir engineering.5-7
When these elements are integrated, decisions can be made and strategy developed for achieving reservoir management goals such as maximizing profitability and economic hydrocarbon recovery.8 9
Reservoir management is an art and skill as well as a science.10-13 No short cuts or easy numerical solutions exist for the complex problem of developing a hydrocarbon resource that adequately substitutes for skill, experience, and vision.
The quality of the management depends on the quality of the analysis and the integrating of the reservoir data.
This article discusses the analysis of the reservoir data that can be determined from various disciplines, shows how these data can be integrated to obtain reservoir description, and summarizes the use of this information in reservoir management.
Waterflooding application
The methodology for a successful reservoir management of waterflooding may be summarized as follows:
• Review and analyze the well's history.
• Revise and analyze the pressure records.
• Study pressure, volume, temperature reports.
• Assess all the conventional and special core analysis.
• Review the production performance along with the well and field history.
• Review all the previous related studies.
• Validate the geological structure and identify the most reliable geological structure.
• Investigate the reservoir mechanisms and performance.
• Estimate remaining oil in place.
• Predict reservoir performance under depletion drive.
• Predict reservoir performance and estimate additional reserves from a waterflood.
• Recommend the possible development plan based on the available data.
Data integration
One of the biggest problems in reservoir engineering is having reliable and accurate data for identifying reserves, drive mechanism, recovery factor, and development plan.14 15
Reservoir data come from a variety of sources and need to be integrated to produce a complete picture of the reservoir. Crossing the traditional boundaries and integrating the work of geoscientists and engineers allows data resources to be better utilized.
The challenge is to know when to integrate and at what level the integration should be take place. The integration may be meaningless unless the integration can better identify reservoir properties and provide more accurate predictions of reservoir performance, leading to optimal hydrocarbon recovery.
In the case of Ferdaus, the cross section of the wells along with the tops of the Upper Bahariya units confirmed that the Upper Bahariya formation is a vertically isolated-stratified reservoir that includes five units: three productive sands and two shale units. Well-completion diagrams, perforated intervals, and production history showed that UB-2 and UB-3 are the main producing units in the Upper Bahariya formation.
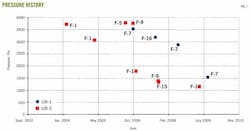
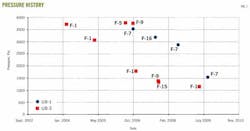
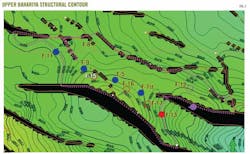
Pressure data when combined and integrated with the geologic interpretations of the Bahariya formation resulted in a more accurate description of reservoir characteristics. The historical pressure records for the Upper Bahariya formation (Fig. 1) were integrated with the location of the wells (Fig. 2). The following could be observed:
• Initial pressure of the two units was close, 3,500 psi for UB-2 and 3,700 psi for UB-3 psi.
• Reservoir pressures at the time of the study were about 1,500 psi for UB-2 and 1,100 for UB-3.
• No vertical communication existed between UB-2 and UB-3.
• Wells F-5 and F-9 at UB-3 showed initial pressure after some depletion from Well F-1. This may indicate the presence of a barrier between Well F-1 and other wells.
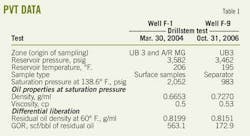
Table 1 summarizes the two available pressure-volume-temperature (PVT) data sets. The PVT data represent crude oil with two different characteristics. This difference may relate to different origins for taking the samples.
The average porosity and permeability of the two units are similar: 16% and 5 md, respectively.
The relative permeability data indicate a variation in the initial water saturation, which varies from 0.4 to 0.6. The data indicated that the initial water saturation increases with depth in UB-3.
Based on their perforated interval data and production history, Table 2 summarizes the production zones for Upper Bahariya producing wells F-1, F-5, F-7, F-9, F-15, and F-16ST2.
Wells F-1, F-5, and F-7 have commingled production. Therefore, the analysis had to allocate the production data to each producing zones.
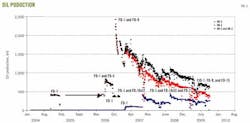
Fig. 3 shows the production history for UB-2 and UB-3. The cumulative production from UB-2 and UB-3 to Oct. 18, 2009, was 206,084 bbl and 1,215,525 bbl, respectively.
OOIP estimate
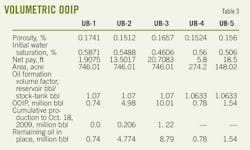
The estimated OOIP in the Upper Bahariya formation was based on both volumetric and material-balance calculations. Table 3 shows the volumetric estimate for the five units.
Four material-balance runs estimated the OOIP. Run 1 included UB-2 producing wells Wells F-1, F-7 and F-16ST2.
Two cases for Run 1 used the production and the pressure data of UB-2 with and without aquifer support. The two cases had the same analytical match when the two curves were superimposed, indicating no aquifer support.
Estimated OOIP from this run was 5 million bbl, which was nearly the same as the volumetric estimate, indicating that UB-2 might be a homogeneous single zone.
Run 2 on UB-3 wells F-1, F-5, F-9, and F-15 assumed all wells were in the same block. Run two also had two cases: with and without aquifer support. Because the cases did not match, the static model assumed Well F-1 was in a separate block in Runs 3 and 4.
Run 3 included only Well F-1 in UB-3, again with two cases of with or without aquifer support. Only the case with aquifer support matched the production and pressure to give an OOIP of 3.9 million bbl.
Run 4 included Wells F-5, F-9, and F-15 in UB-3, with and without aquifer support. The two cases had matching performance when superimposed. Estimated OOIP was 8 million bbl compared with the volumetric estimate of 10 million bbl.
The material balance of the two blocks (Runs 3 and 4) resulted in an estimated 11.9 million bbl of OOIP.
Waterflooding program
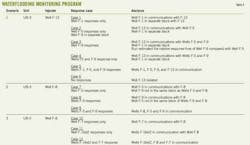
A waterflooding program with three different scenarios and 12 cases investigated the uncertainties of the static model (Table 4).
The design criteria of the waterflooding program took into account the following considerations:
• The unit with a higher remaining oil in place has the priority for waterflooding. Candidates for a waterflooding pilot were UB-3 and UB-2.
• Analysis of the relative well locations with respect to reservoir dip, the existing perforated intervals, and the current production of the wells determined which wells should be converted to injectors. The injectors were Wells F-8 and F-13 in UB-3 and Well F-8 in UB-2.
Additional recovery
The cumulative production for the do nothing case was 0.4 million bbl for UB-2 and 0.77 million bbl for UB-3, as obtained from material balance runs. This assumed a 10 bo/d economic limit and a 500 psi average reservoir pressure at the abandonment.
The Craig model predicted the waterflooding production performance for each scenario. This model was used because it considers the spacing between the wells in the calculations,16 while the material balance does not take this into considerations.
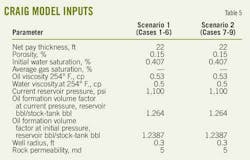
The Craig model required the preparation of Excel spreadsheets. Table 5 summarizes the main input data used with the Craig model. The model indicated that the required constant injection rate was 450 b/d for UB-2 and 300 b/d for UB-2.
Table 6 summarizes the waterflood performance at water breakthrough. The results show that an injection rate of 450 b/d in UB-3 and 300 b/d in UB-2 yields production rates of about 360 b/d and 240 b/d, respectively.
Table 6 indicates that the distance between the injector and the producer strongly affects the breakthrough time. The time to breakthrough increases as the distances between the injector and the producer increases.
Craig Model results concluded the following:
• After breakthrough, the oil rate starts to decline and the water cut sharply increases.
• Waterflooding maintains the reservoir pressure in UB-2 and UB-3.
• Waterflooding in UB-3 was strongly recommended first because this unit had higher remaining oil in place relative to UB-2. The order of the three scenarios will improve recovery, maintain pressure, and provide a way to examine the communication of Well F-1 with the other wells.
• A full scale waterflood will recover about 2 million bbl.
References
1. Saputelli, L., and Nikolaou, M., "Self-Learning Reservoir Management," Paper No. SPE 84046, SPE Reservoir Evaluation & Engineering, December 2005.
2. Yesquen, S., Carro, J.L., and Lopez, L., "Integrated Reservoir Management for Life Extension of Mature and Marginal Oilfeild-Talara Basin, Peru," Paper No. SPE 97637, SPE Latin American and Caribbean Petroleum Engineering Conferences, Rio de Janeiro, June 20-23, 2005.
3. El Hawary, A.M., "Improving Transient Test Interpretation Results Using Reservoir Management," Master Thesis, Arab Academy for Science, Technology and Maritime Transport, College of Engineering and Technology, Cairo, June 2000.
4. Abu El Ela, M., "Data Analysis Methodology for Reservoir Management," Paper No. SPE106899, SPE Europec/EAGE Annual Conference and Exhibition, London, June 11-14, 2007.
5. Raza, S.H., "Data Acquisition and Analysis for Efficient Reservoir Management," Paper No. SPE 20749, JPT, April 1992.
6. Woods, E.G., and Osmar Abib, "Integrated Reservoir Management Concepts," Reservoir Management Practices Seminar, SPE Gulf Coast Section, Houston, May 29, 1992.
7. Trice, M.L. Jr., and Dawe, B.A., "Reservoir Management Practices," Paper No. SPE 22236, JPT, December 1992, pp. 1,344-49.
8. Wiggins, M.L., and Startzman, R.A., "An Approach to Reservoir Management," Paper No. SPE 20747, SPE ATCE, New Orleans, Sept. 23-26, 1990.
9. Haldorsen, H.H., and Van Golf-Racht, "Reservoir Management into the Next Century," Paper NMT 890023, Centennial Symposium at New Mexico Tech., Socorro, NM, Oct. 16-19, 1989.
10. Satter, A., et al., "Integrated Reservoir Management," Paper No. SPE 22350, 1992 SPE International Meeting on Petroleum Engineering, Beijing, Mar. 24-27, 1992.
11. Sarem, A.M., "Questions and Answers: Reservoir Management Panel Discussion," Paper No. SPE 20781, SPE ATCE, New Orleans, Sept. 23-26, 1990.
12. Satter, A., and Thakur, G.C., Integrated Reservoir Management, PennWell Books, Tulsa, 1994.
13. Thakur, G.C., "Implementation of Reservoir Management Program," Paper No. SPE 20748, SPE ATCE, New Orleans, Sept. 23-26, 1990.
14. Abu El Ela, M., "Integrated Approach Recommends Redevelopment Plan," OGJ, Aug. 7, 2006, p. 55.
15. Popa, A., Cassidy, S., and Opsal, S., "Implementing Integrated Solutions for Reservoir Management: San Joaquin Valley Case Study," Paper No. SPE 144468-MS, SPE Western North American Region Meeting, Anchorage, May 7-11.
16. Craig, F.F. Jr., Geffen, T.M., and Morse, R.A., "Oil Recovery Performance of Pattern Gas or Water Injection Operations from Model Tests," Transactions AIME, Vol. 204, 1995, pp. 7-15.
The author
More Oil & Gas Journal Current Issue Articles
More Oil & Gas Journal Archives Issue Articles
View Oil and Gas Articles on PennEnergy.com
