P. 4 ~ Continued - World peak oil production still years away
View Article as Single page
The world economic crisis in mid 2008 tempered demand and caused a production decline in late 2008. But from January 2009 to January 2011, production again rose.
The uprisings in Libya and other Middle East countries in early 2011 have caused a new round of price increases and subsequent decrease in demand for oil, but this too is expected to be temporary.
So what is wrong with the Hubbert model and the analysis of his supporters that has caused their forecasts about the timing of peak oil to be off? I believe that the Hubbert model essentially is correct under a constant price and constant technology scenario. When the oil price increases, however, the value of Qmax also increases as more oil becomes economic to produce. Technology also has an effect.
Technological breakthroughs bring more oil reserves into production even under a constant price scenario. Additionally, an increasing oil price is an incentive for developing new technologies that also increase oil supply. Price increases and technological breakthroughs seem to unlock large volumes of oil that previously were uneconomic to produce.
In the past 20 years, large reserves in the Canadian oil sands in Alberta have come on stream. New fracture stimulation and horizontal drilling technologies also have unlocked large reserves of tight oil, tight gas, and shale gas.
Alberta's oil sands currently have 170 billion bbl of booked reserves and possible reserves may be as high as 1 trillion bbl. In comparison, slightly more than 1 trillion bbl have been produced in the world and Deffeyes and Hubbert estimated that 1 trillion bbl of conventional oil remains to be produced.
Horizontal wells and multizone fracture stimulations are unlocking hundreds of billions of barrels from the Bakken formation in North Dakota, Montana, Manitoba, and Saskatchewan. The success in the Bakken also is opening up more formations to successful production, such as the Eagle Ford in Texas, Granite Wash in Oklahoma and the Texas Panhandle, Niobrara in Colorado and Wyoming, Monterey in California, and Utica in eastern Ohio.
Vast quantities of oil also have been discovered in deepwater Gulf of Mexico and Santos basin off Brazil.
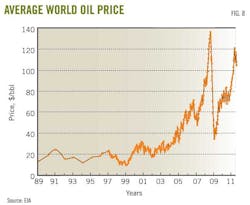
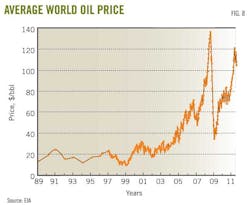
As these technologies mature they will find applications in many other areas in the world. The price increases of 2007-08 and 2011(Fig. 8) have accelerated deployment of these new technologies as well as economic development of other marginal reserves.
From 1986 to 2005, oil prices remained relatively constant at about $20/bbl, but warnings from peak oil theorists may have caused the market to start anticipating supply shortages and this and the political upheavals in the Middle East in 2011 have driven up oil prices.
At the same time, increased oil prices have led to an increased value of the world's remaining oil reserves and delayed the year for peak production. These developments not only affect Qmax and tpeak but will also affect the production decline on the back side of the Hubbert curve.
The history of US gas production has considerable relevance to world oil supply trends. Based on US gas production, the sliding down on the back side of the curve as in Hubbert's forecasts or that theorists expect will not occur.
At this point you might also ask why did the Hubbert model work so well in the prediction of the US oil supply but does not seem to be working, and will not continue to work, for predicting the world oil supply. The answer is simple. The oil market is a world market and the US oil production peaked and declined amidst a relatively constant world oil prices.
Displaying 4/7
View Article as Single page

