Global E&P capital expenditure: trends & determinants
Ghassan Aloshban, Saudi Aramco
Ivan Sandrea, Vienna, Austria OPEC
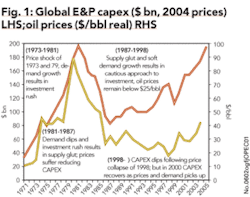
Global E&P capital expenditure (CAPEX) for oil and gas is expected to reach $200 billion (estimate) in 2005, which represents an increase of 50% and 80% versus 2000 and 1995, respectively. In the last twenty years, CAPEX rose almost each year with the exception of a brief period in 1991-1992, and more recently in 1998-1999 when oil prices collapsed to historic lows and the industry cut CAPEX from $140 billion in 1998 to $110 billion in 1999 (Fig 1).
The most recent drop in CAPEX and its subsequent rebound after 2000 are reminders that oil (and gas) prices are important determinants of CAPEX in the short term. However, taking a closer look at the last 20 years CAPEX did not always respond to oil prices in an obvious manner, suggesting that other drivers also play an important role.
The purpose of this article is to summarize the results of a recent study conducted by the OPEC Secretariat, in which the variables that are generally thought to be the main drivers influencing CAPEX were analyzed, including their significance, based on careful statistical analysis. The results of which would either confirm or deny the conjectured cause and effect relationships expressed in the literature regarding the main drivers of global E&P capex.
Methodology
An extensive literature review was undertaken to identify the consensus of how and why E&P capital expenditure varied throughout the years since the 1960’s by reading through the Oil & Gas Journal’s capital spending outlooks, and the WPI (Worldwide Petroleum Industry) Outlook which both include a discussion of CAPEX history which affords more or less the industry consensus of this portrayal.
To discover the underlying correlations between CAPEX and the purported triggers of its ups and downs, a regression analysis (Running an Ordinary Least Squares) was performed using EViews 3.1 for the period of 1971 to 2004, with real capital expenditure in 2004 dollars (CAPEXR) as the dependent variable, and the following identified fields as the independent variables:
• Oil Demand (DEMAND): expressed in millions of barrels of oil per day (mb/d);
• Real Oil Prices (PRICESR): real prices in 2004 dollars; the prices reported from 1971-1975 were Arabian Light as posted at Rastanura. The following years are WTI spot prices;
• Lagged Capital Expenditure (CAPEXR(-1)): capital expenditure of the previous year;
• Non-OPEC Cashflow (CASHFLOWNOPEC): this is not the actual cashflow of non-OPEC but rather an approximation of revenues; calculated by multiplying non-OPEC production of the year by the corresponding average price of WTI;
• Spare Capacity (SPARECAP): OPEC capacity less OPEC production expressed in mb/d.
Finally, in order to explore the evolution of each variable’s influence in CAPEXR, rolling regressions on the five identified independent variables were performed. The objective is to analyze the coefficients and varying Probs to help establish statistical behavioral investment trends. For this, a regression was taken for the same dependent variable and its independents for a smaller period-starting with 1971 to 1986, then moving on to 1972 to 1987-continuing with a regression for each subsequent 15-year period.
This is particularly useful when applied to difficult-to-interpret years while helping to outline what to expect in the near future. It also helps determine the nature of CAPEXR allocations in the later years as part of a continuation of previous trends or if we have reached a fluctuation point.
It must be noted that each subsequent regression represents a 15-year period in and of itself. Each estimation is for a whole 15-year time period, a fluctuation expresses the change that results in the fit of the equation consequent to rolling through an additional year. The data of the rolling regressions is not included in this article (due to space limitations) but the results have been included in the discussion. The data is available upon request.
Summary of initial findings
Our initial findings (Table 1) express a correlation of approximately 92% as illustrated by the R-squared value.
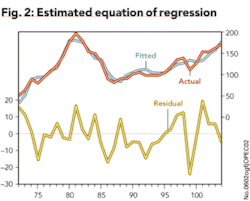
Fig 2 shows our estimated equation (in blue) and actual capital expenditure (red). The residuals (yellow) represent the difference. Worth noting is the difficulty the regression has in fitting the spikes and collapses of CAPEXR in 1981 and 1998 into the estimation indicating that reactions in CAPEXR are difficult to forecast and estimate by the model when dramatic fluctuations or shocks in prices occur.
In terms of the five independent variables chosen, all are statistically significant with the exception of non-OPEC cashflow, which can be rejected as a result of its high Prob value (for the purposes of this study a Prob value of > 0.2 is deemed insignificant and thus rejected). After adjusting for units, it becomes apparent that the variables DEMAND and PRICESR play the most important roles in dictating capital expenditure for our time period with lagged CAPEXR (CAPEXR(-1)) coming in a close second. Worth noting as well is the inverse relationship between SPARECAP and capital expenditure as expressed by SPARECAP’s negative coefficient, which in turn agrees with the overall theoretical backdrop; the abundance of spare capacity indicates a supply glut, which would dampen capital expenditure activities.
A regression including only DEMAND and PRICESR would best express just how important these variables are as estimators of CAPEXR (Table 3). The R-squared number suggests that DEMAND and PRICESR alone can account for 83% of the estimation. The variables themselves have very low Prob values and as such are statistically significant. An important point is that after adjusting for units, the DEMAND coefficient is higher than the coefficient PRICESR, signifying the greater impact it has on capital expenditure. However, note that Durbin-Watson statistics is low, possibly due to miss specifications.
To specify a regression that appropriately reflects the response of CAPEXR to DEMAND and PRICESR, we observed the well-known fact that both of these variables influence CAPEXR decisions after some lapse of time (i.e. decision makers do not change their investment decisions instantly). As indicated by the regression results in Table 4, the estimated coefficients of DEMAND and PRICESR with one-period lag have the expected signs, confirming the findings of Table 3, however with a higher Durbin-Watson statistics that does not indicate the problem of serial correlation.
null
Relationship with oil demand
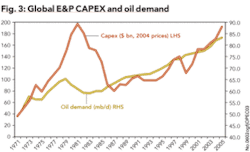
The results of the study indicate that DEMAND plays the most prominent role in determining the amount of CAPEXR the industry commits. Looking at the periods, DEMAND is statistically insignificant until we reach the period of 1973 to 1988. This makes sense considering the price rally that occurred coupled with falling demand during the period from 1979 to 1983. Capital expenditures are not captured by demand until the inclusion of 1988 when prices bottom out and demand regains significance.
This result contradicts the view held by the industry which believes CAPEXR began trailing prices following the demand peak in 1978. According to the regression, no fluctuation occurs to the variable’s Prob value with the first inclusion of this year. Thus it may be incorrect to assume that CAPEXR began trailing prices. Demand does fall from 1979 to 1983, but it only corresponds to a small spike in capital expenditure that can be accounted for in the estimation. The regression ultimately expresses a healthy correlation.
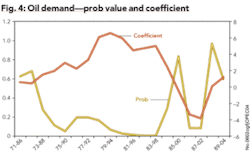
Another period of significance is 1985 to 2000 where we see a spike in DEMAND’s Prob value (Fig 4). This is immediately followed by a period of high significance but with a negative coefficient, where increases in demand correspond to falling CAPEXR. We notice the anomaly occurring as the regression progresses from the 1983 to 1998 period, the price collapse of 1998 creates a noticeable dip in CAPEXR while demand grows unabated (demand growth picked up in 1997 after several years of soft growth between 1990 and 1997), creating a misfit in its significance as an explanatory variable.
The final years (1998 to present) represent another statistically insignificant period, but the trend is towards a fall in the Prob value meaning the variable is gaining significance, as such the negative coefficient cradled by the two spikes can be seen as the ebb and flow of the price collapse.
Relationship with oil prices
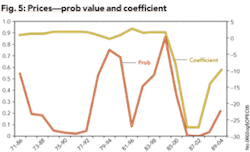
Oil prices also occupy a pivotal role in determining the level of CAPEXR. However, upon inspection of the rolling regressions, we notice some anomalous behavior in certain periods; the initial period is one example (1971-1986). The Prob value starts off high for the period indicating that the regression found it problematic to fit this variable into its estimation, but as the regression progresses bringing the price shock of 1973 to the beginning of the regression rather than the middle, PRICESR becomes statistically significant (Fig 5).
The Prob value also experiences some turbulence during the transition from the period of 1977 through 1992 to the period of 1978 through 1993. This occurs primarily because between 1991 and 1995, real prices fall, but between 1993 and 1998 CAPEXR is increasing. This begins to correct itself in 1997 after a small rally in prices counteracts the inverse relationship that was briefly experienced.
However, the Prob value increases again due to a lag in CAPEXR response to the price crash of 1998, but as Prob values begin to decrease once again, something peculiar occurs...prices begin to recover steadily without a response in CAPEXR; which reflects the cautious approach to investment producers began to take. The value of the price coefficient goes into a sharp decline signifying that on the whole, the different interactions between PRICESR and CAPEXR create a statistically significant period (1987-2002) where an inverse relationship between these better fits the estimation. This does not last for long as prices increase until a positive response from CAPEXR is incited, causing another fluctuation in the Prob values.
A key distinction between the earlier and later periods is that following the 1973 and 1979 oil price shocks, expectations were for prices to remain high. Whereas, after the oil price collapse of 1998, the industry as a whole exhibited a bearish price outlook until 2002, which lends to the inverse relationship experienced in the 1987 to 2002 regression. An interesting point is that demand and prices are intertwined; however, for the most part demand possesses a positive correlation with capital expenditure, unless a price shock occurs. In that case one can abandon the correlational nature as a shock will alter investment behavior in the short term regardless of demand.
Within a certain threshold of “healthy” prices, demand seems the most effective in dictating the level of CAPEXR. What isn’t stable is the degree of its reaction to demand changes, as the coefficient frequently changes in magnitude. On the other hand we have prices; industry consensus was correct in its interpretation of events during the price spike. CAPEXR responded to the increases actively, but the turbulence in the Prob values afterwards indicates the unreliable nature of depending on prices alone as an explanatory variable. In addition to the interaction of the various explanatory variables, one must take into account the fact that reactions to price increases or decreases are less reliable given price volatility whilst demand is more reliable in this sense.
Relationship with lagged capital expenditure
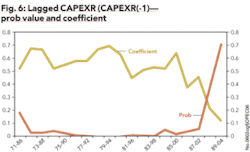
As one might expect, the previous year’s capital expenditure provides the most stable estimator of the current year’s capital expenditure. The Prob values are well below the desired threshold, the coefficient is fairly stable averaging approximately 0.6 for the majority of the periods (Fig 6). The pattern breaks with the inclusion of the 1987 through 2003 period. Before this occurs, we notice a downward trend in the coefficient, indicating that the variable now needs higher values to achieve the same impact on capital expenditure. This is quite irregular considering the variable’s track record; our interpretation is that such break from the norm is highly reflective of the nature of the trepidation the industry has been experiencing with regards to investment decisions as of late. When a prominent and stable variable undergoes such a transition, it entails a period of flux.
Relationship with spare capacity, non-OPEC cashflow and other variables
Spare capacity and non-OPEC cashflow were not very successful estimators of CAPEXR given that they are statistically insignificant for the majority of the period covered. The variables only become statistically significant with the progression between 1985 to 2000 and 1986 to 2001.
As they make this transition they achieve a relatively high coefficient value whilst, both DEMAND and PRICESR experienced a negative correlation with capital expenditure. However, this is not indicative of any changes in these variables’ (DEMAND and PRICESR) overall or long-term dependability. It can be conjectured that in the aftermath of a price collapse, non-OPEC cashflow and spare capacity may qualify as adequate estimators of CAPEXR, but the long-term relationship is not strong.
Three additional variables were studied: E&P Return on Capital Employed (ROCE) as a measure of profitability, Finding and Development costs using data available from US companies, and global rig count. However, several tests indicated that these variables were also not statistically significant in determining CAPEXR during the majority of the periods studied over the long term; in addition we did not have a complete time series for ROCE (only available from 1986 onwards) which created additional problems.
Impact of global E&P CAPEX on non-OPEC oil supply growth
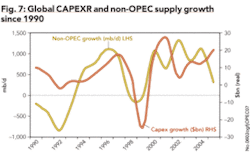
It is worth noting that during the 2000 to 2005 period non-OPEC oil supply growth averaged 800 thousand barrels of oil per day (kb/d) (2%) and CAPEXR growth averaged 10% ($14 billion) per year, while in the 1990 to 1999 period non-OPEC oil supply growth averaged 150 kb/d (0.4%) and CAPEXR growth 3% ($2.5 billion) per year (Fig 7).
Two additional points are important: (1) the rebound in non-OPEC supply from 2000 was synchronous with the recovery in CAPEXR and oil prices following the price crash of 1998/99, and (2) excluding the impact of technical and weather related accidents (i.e. US GoM, Norway, etc.), average supply growth during the period of 2000 to 2005 would have been higher, resulting in record growth rates. Therefore, the recent response in non-OPEC oil supply growth (despite setbacks due to accidents) clearly reflects a rebound in investment. This response is strong if compared to its historical performance.
In OPEC, oil production and capacity also increased during the 2000-05 period despite unintended capacity losses in some countries; this was also the case for the 1990 to 1999 period. Looking ahead to the end of this decade, current projections point to a significant increase in oil (and gas) production capacity from a wide range of projects in OPEC and non-OPEC to meet expected demand growth; this, in turn, is likely to be underpinned by sustained and rising levels of CAPEXR.
Highlights/Conclusions
• In terms of the variables chosen, PRICESR and DEMAND play the most important roles in determining CAPEXR with lagged (CAPEXR(-1)), coming in second.
• Oil demand maintains a strong influence over CAPEXR, even after it peaked in 1978. The years in question are 1981 through 1987, during which oil prices and CAPEXR fell but oil demand did not follow the same dramatic pattern. However, a break from this relationship can occur in the event of extreme fluctuations in prices.
• Amid the recent rally in prices, a more pronounced response in CAPEXR was expected by some and has pervaded industry literature. However, in 2005 CAPEXR is expected to be 50% and 80% higher, versus 2000 and 1995, respectively. Therefore, these claims seem exaggerated; the response by many standards is adequate; it may not be in the same vein as pasts investment rush, but it is substantial and this is often overlooked. Similarly, the recent supply response to CAPEXR increases has been significant-also often overlooked.
• No one doubts the importance and relationship between PRICESR and CAPEXR, but the weight this variable has as a determinant of CAPEXR in the long term is questionable based on the evidence. The bearish sentiment following the price collapse of 1998/99 did not become bullish again until 2003. Given the experiences following the investment rush that occurred in the 1970’s and 1980’s, post 1998/99 the industry favored a more cautious approach to investment. However, the cautious approach since 2000 has been a global feature across many other businesses according to a recent report in The Economist.
• Investment decisions in capital intensive industries tend to be based on expected dynamic long-term fundamentals such as demand, full-cycle project economics, expected long-term prices, and strategic reasons - few decisions are made based on current economic conditions or without some strategic rationale. Right or wrong, this is broadly the philosophy of companies in capital intensive industries where the risks are high and mistakes can be very costly. The results of this study support this general philosophy.
• It should be noted that the conclusions reached relate specifically to the aggregate global E&P picture, prudence is required when attempting to apply the global relationships established to an individual producer level. The microeconomic model of behavior will vary substantially from the macroeconomic model, and so will the results.
• The relationships established do not necessarily imply that these can be directly adapted to a forecasting model for global E&P CAPEX. The regression relies on demand and prices, therefore the forecast would only be as good as the demand and price forecast. However, we believe that a mechanism exists and could be developed further.
Comment on the statistical analysis
A point of weakness that may be alluded to in the regressions is the Durbin-Watson statistics, which is required to be near 2.00 in order to accept the absence of serial correlation. To accept the regressions as statistically viable, one must run a number of tests if there are any lagged variables, as is the case with our regression due to the inclusion of CAPEXR(-1) due to the inadequacy of the Durbin-Watson statistics in such an event. The tests that need to be run are the Serial Correlation LM Test and the H-Durbin Watson Test. Both tests were run using EViews and returned results indicating the absence of serial correlation. A measure which reinforces these results is provided in the regression that was run with DEMAND and PRICESR as the sole independent variables, and DEMAND and PRICER lagged by one year, which returned similar results to the regression run with the questionable variables. $
References
• Oil & Gas Journal, Capital Spending Outlooks (www.ogj.pennnet.com)
• Worldwide Petroleum Industry Outlooks, PennWell
• OPEC Annual Statistical Review (2004), www.opec.org
• E&P surveys by Citigroup, Lehman Brothers, and Merrill Lynch
• Sandrea, R., Imbalances among oil demand, reserves, alternatives define energy dilemma today, Oil & Gas Journal, July 12, 2004.
• The World in 2006, The Economist, page 113
Acknowledgement
The authors would like to thank OPEC Secretariat and Saudi Aramco for their support. This study took place during the OPEC Summer Fellowship program which runs every year in Vienna, bringing experts from member countries to conduct research topics on energy related subjects. We also thank Dr. Ahmad Jalali-Naini [[email protected]] for sharing his expertise and constructive review. The views expressed in this report are those from the authors and do not represent those of OPEC or Saudi Aramco.
The Authors
Ghassan Aloshban [[email protected]] is a market analyst with the corporate planning department of Saudi Aramco. His work focuses mainly on supply/demand analysis in the department’s outlook group. Ghassan is an Amherst College graduate with a double major in computer science and economics.
Ivan Sandrea [[email protected]] is the principal oil supply analyst for the Organization of the Petroleum Exporting Countries (OPEC). He previously worked as a global E&P analyst for Merrill Lynch in London, and prior to this as an exploration geologist for British Petroleum in Venezuela, Norway, and Egypt. He holds a BS in geology from Baylor University, an MS in petroleum geology, and an MBA from Edinburgh University.


