Mixed evidence from shale well decline rates
MORE STABLE INITIAL OUTPUT, BUT MORE AGGRESSIVE TERMINAL DECLINE
ARTEM ABRAMOV, RYSTAD ENERGY
THERE HAVE BEEN MANY impressive observations on the productivity improvements for shale wells over recent years. These improvements have been driven by a combination of boosted completion intensity, "high-grading" of drilling locations and general technological advancements. While significant attention is paid to the increasing initial oil output per well, improvements in decline rates and consequently ultimate recovery (EUR) are often overlooked. Largely, this is explained by the necessity to make speculative assumptions of well lifetime and long-term decline profile, but as of today, we do not possess sufficiently long empiric history for shale wells.
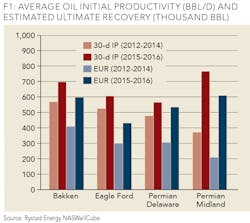
When EURs are calculated with the same methodology across all shale wells, their evolution over time can be reasonably compared with the changes in initial productivity. Figure 1 demonstrates how average oil 30-day initial production and 30-year EUR changed from 2012-2014 to 2015-2016 in major liquid plays. Only horizontal wells are included and EUR calculation is conducted at well level with a terminal decline assumption of 10%. It can be concluded that both average EURs and IP rates increased significantly over time in all plays. However, while IP rates improved by approximately 20% in the Bakken, the Eagle Ford, and the Permian Delware and doubled in the Permian Midland, EURs demonstrated a 40%-75% increase in these plays except for an outstanding increase of 190% in Permian Midland.
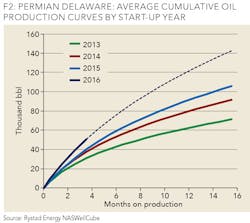
The main contributor to the improvements in total recoverable volumes is the growing popularity of restricted flow completions and lower decline rates, which is a result of increased completion intensity. In 2012, a typical shale oil well was fracked with 0.64 thousand lbs of sand per feet. This number has now more than doubled. The Permian Delaware is one of the major plays where restricted flows and pressure control have become standard. Figure 2 shows how evolution of average cumulative oil output per well changed from 2013 to 2016. Only official production data is included and the dotted line for 2016 shows the most likely continuation of cumulative production if wells continue their current decline profiles.
In 2013-2014, the pace of cumulative production additions dropped quickly during the first months on production with average production additions falling from 10,000-12,000 barrels in the second production month to less than 5,000 barrels after six months on production. Meanwhile, wells spud in 2014 and 2015 had identical performance during the first four months on production delivering just above 40,000 barrels throughout this initial period. After the first four months, lower decline rates impose a gradual increase of the gap between the 2014 and 2015 cumulative production curves with 15% higher cumulative output observed after the first 16 months.
In addition to even lower decline rates in 2016, continuous high grading led to increased IP rates and 25% higher volumes delivered in 2016 than in 2015 during the first four months of production. If wells keep tracking their current decline curves, the gap will increase to 35% over the next year.
While clear improvements in initial decline rates are supported by empiric data, there is a limited evidence for sustainability of long-term decline profiles. Using modified Arps model to describe shale well production profile, early production data often suggest high hyperbolic factors, which result in nearly flat production profile five to six years after start-up. Terminal decline assumption is commonly used and a typical assumed boundary for annual decline rate varies between 3% and 8%. Empiric data for early shale wells suggest that this assumption is too optimistic.
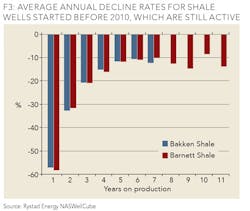
Figure 3 shows average annual production declines for Bakken and Barnett wells that started before 2010. It includes only non-refracked wells, which are still active in 2016. Only the first seven years are shown for Bakken as the results become inconclusive due to the steep reduction in sample size after seven years. Looking at the figure, it can be inferred that both oil and gas shale wells struggle to achieve annual decline rates below 10%. Even though a typical shale well produces almost half of the ultimate recovery during the first five to six years of well lifetime, a terminal decline assumption of 10% could lead to 15%-20% lower EURs compared to the pure hyperbolic decline profile.
Naturally, due to technological advancements, injection programs and re-frack potential, the production profiles of old shale wells may not be completely relevant for future inference. Regardless, with lack of more relevant data, the empirical evidence suggests that it is too early to justify terminal declines below 10%.
ABOUT THE AUTHOR
Artem Abramov is a senior analyst at Rystad Energy with main responsibilities in analyzing upstream E&P data from governmental sources along with empirical research of well production profiles. Artem is the product manager for the NASWellCube, Rystad Energy's NAM Shale well database. He holds an MSc in Financial Economics from BI Norwegian Business School and a BSc in Applied Mathematics with the Major in Statistics from the Novosibirsk State University, Russia.


