Bakken Shale
Continuous improvement in well performance and economics for Bakken Shale wells
MAIERDAN HALIFU, RYSTAD ENERGY
IN ORDER TO COPE with the low price environment in 2016, shale focused companies have announced that they will prioritize developing their best acreage and optimizing their completion techniques. In the last few months, more and more operators have communicated that they have achieved better well performances compared to previous years with much lower well costs. We will try to answer how the operators are achieving this by studying the activity in the Bakken Shale play.
Continental Resources photo
Bakken completion trend
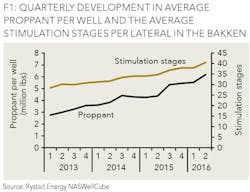
In the Bakken, the main completion trend is to drill and complete wells with more proppant and more stimulation frac stages. Figure 1 shows the evolution of the average amount of proppant per well and the average number of stimulation stages per well from 2013 to 2016.
One can see a clear trend that in 2016 both average proppant per well and average stimulation stages have increased compared to previous years. In Q2 2016, the proppant per well averaged over six million lbs. One driver for the increased proppant per well is the increase in frac stages. The average number of stages per well has now reached above 40. Many operators in Bakken are following this trend, such as Hess, Statoil, WPX Energy, and Whiting Petroleum. In August 2016, Hess communicated in its Q2 earnings call that it is in a transition from a 35-stage completion design to a 50-stage completion design. At the same time, each stage is using more proppant. In the Bakken Shale, the average proppant per stage has increased from 125 to 150 lbs during the last three years.
Bakken Well performances continue to increase
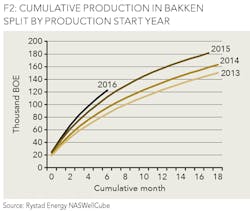
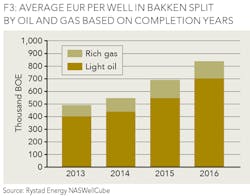
As of September, operators in the Bakken have completed about 500 wells in 2016. Most of these wells are located in McKenzie, Dunn, Mountrail and Williams counties. In August 2016, Whiting Petroleum reported its enhanced completions are tracking a 900 thousand boe EUR type curve. Continental Resources also reported that the EUR for its 2016 wells averaged at 900 thousand boe. Figure 2 shows the average well curves split by the year in which the wells were put on production. It is clear the wells completed in 2016 have higher production compared to the wells completed in previous years. Figure 3 shows the evolution of the average EUR per well throughout 2013 to 2016. One can see that the average EUR per well has reached around 840 thousand boe in 2016.
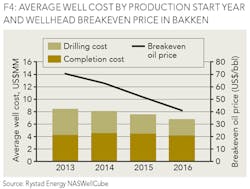
Figure 4 shows the average wellhead breakeven oil price and the average well cost in the Bakken for wells put on production from 2013 to 2016. Well costs have been going down over these years. Furthermore, based on the above analysis on EUR, it is not a surprise to see a steady reduction in wellhead breakeven prices in the Bakken from 2013 to 2016. The average well cost for drilling and completing a well in 2016 is estimated at around US$6.8 million, with the potential for additional reductions by year-end. Based on the current well cost estimates, the average wellhead breakeven price is expected to average US$40 per bbl for 2016, about a 20% reduction from the 2015 level. This is a big achievement for shale companies operating in the Bakken; operators have managed to increase the average well performance while reducing well costs.
Conclusion
As the industry continues to experience the effects of a longer term and a more pronounced downturn, E&P companies have become more judicious in deciding what acreage to drill, and more efficient when drilling while optimizing completion design. These trends are exemplified in the increase in average proppant per well and the average number of stimulation stages per well in the Bakken Shale as well as the concentration of the rigs in the four 'core counties' of the Bakken. As a result of these trends, we continue to see an increase in the average well EUR and a continuous drop in average well costs and wellhead breakeven oil price. We can expect to see these trends being replicated throughout the North American shale space, as the commodity price requires innovative strategies for companies to maintain profitability.
ABOUT THE AUTHOR
Maierdan Halifu is an analyst at Rystad Energy with main responsibilities in analyzing upstream activities in North America, China, and Southeast Asia with a focus on asset modeling and valuations. Maierdan holds a MS. in Finance from the University of Gothenburg, Sweden and a BS. in Applied Mathematics from Malardalen University, Sweden. He works in Rystad Energy's Houston office.


