Permian Midland
Play surpasses all US shale in Hz rigs running
SONA MLADA, Rystad Energy
SINCE THE BEGINNING of June 2016, Permian Midland has surpassed Permian Delaware in terms of activity and has become the play with the highest number of active horizontal rigs. As of August 5, 2016, there were 81 horizontal rigs running in the play, which represents over 22% of the total active rig fleet in the US shale. For comparison, there are 29, 31, and 78 active rigs in the Bakken, Eagle Ford, and Permian Delaware, respectively. Permian Midland has been the play with the fastest recovery of the number of running rigs among all US shale plays; since the bottom of 53 horizontal rigs in April 2016, it grew its fleet by over 52% until now.
At the same time, operators are continuing to engage their best rigs to drill in the Permian Midland. In fact, nearly 100% of all newly constructed rigs in 2016 in the US shale have been allocated to the Permian plays. Currently, 39% of the rigs running in the Permian Midland have been constructed after 2015. This is the highest proportion compared to other plays, e.g. Eagle Ford (22%), Bakken (23%) or Permian Delaware (31%).
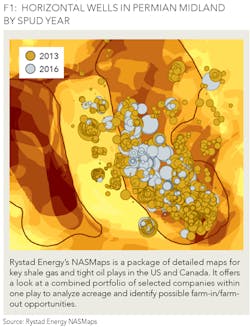
Figure 1 depicts the Turned in Line (TIL) horizontal wells in Permian Midland in 2013 and 2016. Each of the dots represents an individual horizontal well, while the size of the pie shows the corresponding 30-day IP rate, and the color indicates the TIL year. We can observe three trends from the map: Firstly, the activity shifted heavily towards the core areas from 2013 to 2016. Secondly, we can clearly observe more monster wells in 2016. Lastly, there are nearly no wells in 2016 with visibly poor and unsuccessful performance, while we can see relatively many of them in 2013. In fact, the 30-day IP rates have increased on average by nearly 17% year over year from 2013 to 2016.
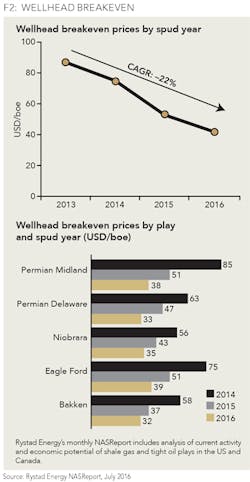
Over the last four years we have observed a significant decrease in the wellhead breakeven prices across all shale plays in the US. As Figure 2 indicates, the average wellhead breakeven prices fell by 22% year over year from 2013 to 2016.
Among the key shale plays, Permian Midland has experienced the largest drop in breakeven prices, falling by 33% year over year on average from 2014 to 2016. For comparison, the wellhead breakeven prices for the other key shale plays decreased by 25%, 27% and 28% for Bakken, Eagle Ford and Permian Delaware, respectively.
There are several factors creating downward pressure on the breakeven prices in North American shale. Firstly, the drilling costs have decreased significantly as a result of efficiency gains on the drilling side. This decrease occurred hand-in-hand with the collapsing unit prices due to a lower demand, particularly after the beginning of 2015. Secondly, boosted completion intensity has improved the well productivity. Some technological advancements worth mentioning are slick-water completions, higher proppant use, pressure control, and more frac stages per well. Lastly, since operators are currently running their best rigs in the best parts of their acreage, we observe a significant high-grading of the drilling locations.
One of the key strategic decisions made by several large shale operators during the current oil price downturn was to intentionally delay well completions. The well fracklog, or so-called DUC (Drilled Uncompleted) inventory represents the wells that have been drilled but are awaiting completion. This fracklog can be split into two different categories: the "normal" fracklog represented by the wells that have been spudded less than six months ago and "abnormal" fracklog represented by wells that have been spudded more than six months ago. Currently, there are some 2,250 DUC wells spudded more than 6 months ago, which represents almost 60% of the total DUC inventory.
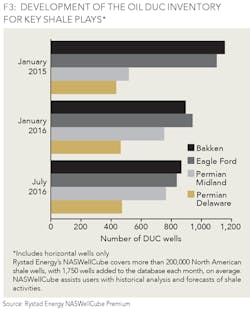
Figure 3 shows the total oil DUC inventory (normal and abnormal combined) for horizontal wells in the key US shale plays. As the chart indicates, all major plays are exposed to the completion delays. For both Bakken and Eagle Ford we observe a decrease of the total fracklog from the beginning of 2015 until now. At the same time, the number of DUCs remained relatively flat for Permian Delaware, while we see an increase of the DUCs for the Permian Midland from January 2015 to July 2016. The reason for this different development can be explained by looking at the total number of spudded and completed wells per month in each play. In the Permian Midland, the drilling activity was higher than the completion activity during the second half of 2015 and the first months of 2016, unlike in the Eagle Ford or Bakken. This came as a result of a relatively large number of operators in the Permian Midland that maintained high drilling activity levels despite the oil price downturn.
ABOUT THE AUTHOR
Sona Mlada serves as the lead Canada onshore and offshore activity analyst at Rystad Energy. She is the project manager for Rystad's North American Shale Report and is responsible for analyzing global discoveries and estimating recoverable resources. She holds a degree from the University of Economics in Bratislava, Slovakia, including a graduate exchange program at Universidad de Granada, Spain.


