Measuring unconventional well performance
MULTIPLE PARAMETERS SHOULD BE CONSIDERED
PER MAGNUS NYSVEEN AND LESLIE WEI, RYSTAD ENERGY
OPERATORS GENERALLY report the initial production (IP) of wells to help investors measure well performance and benchmark results with peers. However, to understand the economics behind a shale well, additional parameters need to be considered.
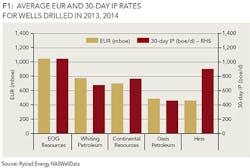
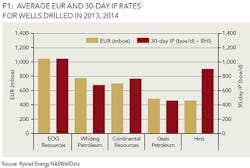
Examining the Bakken wells drilled in 2013 and 2014, Figure 1 compares the Estimated Ultimate Recovery (EUR) and 30-day IP rates for the five most active operators in their core areas. EOG Resources is the leader in both categories with a record EUR of ~900 mboe and average 30-day IP of ~1,200 boe/d. The correlation among the remaining four operators is less clear. Whiting Petroleum Corp. has the second highest EUR but realizes the second lowest IP rate, while Hess Corp. has the second highest IP and the lowest EUR. The lack of a trend for most of the operators indicates a weak correlation between the two variables.
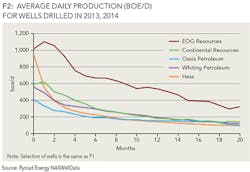
To understand the relationship between IP and EUR, it is important to examine the production for a typical well throughout its lifetime. For shale wells, the discrepancy can be explained by the operator-specific decline rates. Figure 2 shows the average well curve for the same operators and areas for wells that started in 2013 and 2014. Hess has a high initial production, but the wells also decline quickly, resulting in an overall lower recovery rate. Looking at Continental Resources, the constant flow rate during the first month indicates the company is choking back some of its production. This method of production increases the stability of the reservoir and results in a lower decline rate. EOG Resources stands out in Figures 1 and 2 as having the highest initial production and relatively low production decline through the first 20 months. To determine how the company manages to perform so much better than its peers, it is important to review the completion data for each of the operators.
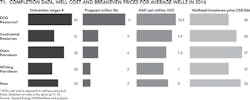
Table 1 shows the average stimulation stages, proppant, well cost and wellhead breakeven prices for wells drilled in 2014. In general, stimulation stages do not vary significantly between operators, with 34 frac stages on average. The deviation in proppant usage is more obvious. Compared to the other operators, EOG's 11 million lbs of sand per well is nearly three times higher than its second largest peer, Continental, with four million lbs. While these well configurations are largely reflected in the well cost, the overall costs may also be impacted by other factors not shown (i.e. lateral length, drilling efficiency, fracking technique). The trade-off between additional production and higher well costs can be observed in the breakeven prices. EOG has the most expensive wells, but the high EURs lead to the second lowest breakeven price in the peer group at $40/bbl. Whiting, the company with the second lowest IP rates has the best price of $37/bbl mainly because of its relatively low well cost, and simple completion technique.
Comparing EOG and Whiting in Bakken, it is evident that two different completion techniques can yield the same rate of return. This implies that the most complicated wells are not necessarily the most economical.
ABOUT THE AUTHORS
Per Magnus Nysveen is senior partner and head of analysis for Rystad Energy. He joined the company in 2004. He is responsible for valuation analysis of unconventional activities and is in charge of North American shale analysis. Nysveen has developed comprehensive models for production profile estimations and financial modeling for oil and gas fields. He has 20 years of experience within risk management and financial analysis, primarily from DNV. He holds an MSc degree from the Norwegian University of Science and Technology and an MBA from INSEAD in France.
Leslie Wei is an analyst at Rystad Energy. Her main responsibility is analysis of unconventional activities in North America. She holds an MA in economics from the UC Santa Barbara and a BA in economics from the Pennsylvania State University.


