Eagle Ford, Bakken, and Permian
RYSTAD DETAILS OIL PRODUCTION FORECAST AS IT EXPECTS A MERE 3% DROP FROM PEAK TO EXIT 2015
PER MAGNUS NYSVEEN AND LESLIE WEI, RYSTAD ENERGY
The behavior of North American shale is a key driver for the balancing of the oil markets in the short term. Official results have proven the resiliency of shale in 2015 as production values continued to climb for the first half of the year despite the ~50% drop in the rig count. While production will decrease for the remainder of the year, the drop is expected to be minimal due to the efficiency and shifts in operational approaches.
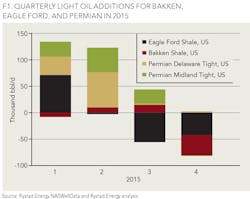
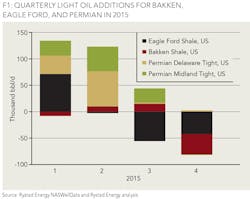
Eagle Ford, Bakken, and Permian make up ~75% of the 2015 unconventional light oil production in the US. Figure 1 shows the 2015 quarterly light oil additions for the three plays. Eagle Ford production increased 70 kbbl/d in the first quarter, but will experience the largest decline during the second half of the year as the main operators (Chesapeake, EOG Resources, and Marathon Oil) continue to decrease the rig count. Permian Midland's oil production grew during the third quarter, driven mainly by Pioneer Natural Resources, where the company doubled its rig count from April to October. Permian Delaware will have flat production for the rest of the year where the average rig count increased slightly at the end of the summer, but has since returned to the bottom level. Bakken production was positive in the third quarter, but will drop in the fourth quarter as the result of consistently lower rig counts takes effect. Overall, Rystad Energy expects to see a decline of ~3% in unconventional oil production from the three big plays from the peak in early summer to the end of the year.
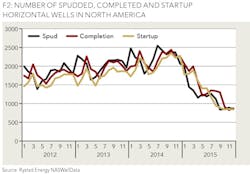
One of the main drivers for the slow production decline is the development of the Drilled-yet-Uncompleted wells (see "Reexamining shale as a swing producer," October OGFJ). Figure 2 compares the spud, completion, and startup time for horizontal wells in North America. From 2012 to the end of 2014, there was an average delay of four months between the spud and completion of wells. Since the end of 2014, the trend shifted as operators began completing more wells than they spud. This indicates that the time between spud and completion should be a dynamic factor, and that the current rig count is not a good predictor of production. The relationship between completion and startup also changed in 2014, when the startup of wells followed the completion much closer. The result is wells coming online faster in 2014 compared to 2013.
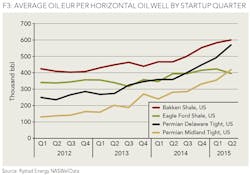
In addition to the number of wells put onto production each month, it is also important to consider the productivity of each well put online. Figure 3 shows the average EUR per well for the main shale plays by spud quarter. The EUR per well is estimated using the reported Initial production (IP), observed decline, and a play specific hyperbolic factor. Since 2012, EUR increased over 100% on average as operators tend to drill longer laterals, more completion stages, and increase proppant usage. The combined effects of these three factors have resulted in continuously higher EURs each quarter. Well results in 2015 increase even more as companies focus the lower rig count on the very best acreage. The EUR results of the latest wells are an important factor in predicting the monthly production forecasts.
Short-term forecasting is challenging, as there are many moving parts. A robust approach is to have a well-by-well model continuously refreshed with the latest official results and company reporting to capture all the dynamics in the industry (NASWellData). Based on such a model, Rystad Energy estimates that oil production from the US will only drop 3% from peak to exit 2015.
ABOUT THE AUTHORS
Per Magnus Nysveen is senior partner and head of analysis for Rystad Energy. He joined the company in 2004. He is responsible for valuation analysis of unconventional activities and is in charge of North American shale analysis. Nysveen has developed comprehensive models for production profile estimations and financial modeling for oil and gas fields. He has 20 years of experience within risk management and financial analysis, primarily from DNV. He holds an MSc degree from the Norwegian University of Science and Technology and an MBA from INSEAD in France.
Leslie Wei is an analyst at Rystad Energy. Her main responsibility is analysis of unconventional activities in North America. She holds an MA in economics from the UC Santa Barbara and a BA in economics from the Pennsylvania State University.


