Shareholder value and lessons learned
Oilfield equipment and services (OFS)
CHRIS ROSS AND VIKRAM ENJAM, UNIVERSITY OF HOUSTON CT BAUER COLLEGE OF BUSINESS, HOUSTON
EDITOR'S NOTE: This article is the second of three from University of Houston CT Bauer College of Business professor Chris Ross and UH Bauer College of Business MBA student Vikram Enjam about financial and operational metrics that have driven shareholder returns during the 2002 - 2016 oil and gas cycle. Part one of the series ran in the January 2017 issue of OGFJ.
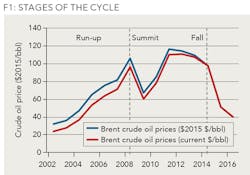
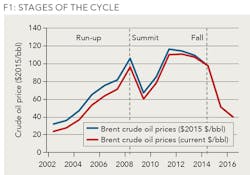
THE FIRST ARTICLE in this series covered the drivers of shareholder value in the upstream sectors of the oil and gas industry as the most recent cycle moved through its stages of "Run-up" from 2002-08 from 2008-2014 as the market left behind the "Long Grind" of the 1990s, through the "Summit" of sustained but volatile high prices, and onto the "Fall" from 2014 through mid-2016 (Figure 1).
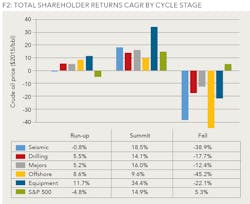
Drivers of OFS shareholder value (TSR) TSR for the OFS sector, like the upstream sectors, is highly correlated to international oil prices. Most segments beat the S&P 500 in the Run-up and at the Summit and all segments declined sharply in the Fall (Figure 2). Seismic and Offshore segments were particularly badly hit as oil companies cut exploration and cancelled major projects.
However, the different segments of the OFS sector showed different drivers of TSR: for the Seismic companies TSR was positively correlated with reinvestment in the business during the Run-up period to produce revenue growth over the Summit; TSR and ROC was strongly positively correlated and rising debt strongly negatively correlated in all periods. TSR of the Major OFS companies was positively correlated in all periods with Return on Invested Capital (ROIC) and with change in dividends per share, but either not or negatively correlated with revenue growth.
Drillers, offshore and equipment companies' TSR was positively correlated with total debt in the Run-up, negatively in the Summit and positively again in the Fall, illustrating the intense whiplash experienced in the cycle by these segments and their reliance on financial engineering.
Seismic acquisition and processing
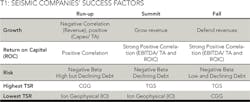
Seismic company TSR in the Run-up stage was strongly negatively correlated with revenue growth, but also to a lesser extent positively with capex/ total assets implying that the companies that were investing most in data acquisition infrastructure were most highly valued but that rapid revenue growth in that stage was less well appreciated. During the Summit period, investors valued revenue growth but there was no correlation with further investment in equipment. Over the three stages of the cycle, there was a strong and rising correlation between TSR and ROC and a strong negative correlation with debt and change in debt as well as with beta. Thus, the companies that responded to investor signals to invest in equipment in the Run-up were penalized in the later periods for taking on increasing debt (See Table 1).
The CGG business model of vertical integration from seismic equipment manufacture and ownership, data acquisition and processing responded well to the value drivers in the Run-up stage. However, TGS outperformed its rivals in the Summit and Fall stages using an "asset light" business model, leasing equipment to be more responsive to the changing business environment while CGG struggled with high debt and low returns on capital.
Major integrated equipment and service providers
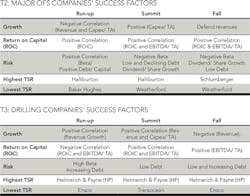
TSR for the major OFS companies was consistently in all stages positively correlated with ROC. Revenue growth (lower revenue decline) was positively correlated in the Fall period. Total debt and change in debt level were negatively correlated with TSR in the Summit period and dividend growth was highly and positively correlated in the Fall period. In summary, Major OFS companies created highest TSR by investing cautiously in capital projects relative to their peers, growing slowly, sustaining high ROC, low beta and low debt, while growing dividends per share (See Table 2).
Halliburton was the clear TSR leader in the Run-up and Summit stages, demonstrating strong financial discipline in the Run-up and leveraging its leadership position in pressure pumping and other fracturing services to deliver high returns on capital in the Summit stage. Schlumberger's size and diversity led to least value erosion in the Fall stage.
Contract drillers
TSR for the drillers has been particularly strongly influenced by the cycle. In the Run-up stage, highest TSR went to companies that delivered revenue growth at the expense of ROC, took risks with increasing debt and thereby showed high beta. In some cases, this was risky strategy was adopted in response to activist investors. In the Summit stage, highest TSR went to companies still committed to growth, but with highest ROC and low debt. In the Fall stage, TSR was highest to companies with least revenue growth, but with highest EBITDA/ Total Asset returns, capable of taking on increased debt to reinvest capital in the business (See Table 3).
Helmerich and Payne reaped the benefits of strong capital investment in the Run-up stage to be prepared for the surge in shale oil drilling and deliver high growth and highest returns on capital in the Summit stage. HP entered the Fall stage with relatively low debt, could increase dividends per share and suffered least value erosion. Transocean struggled in the Summit stage with financial and reputation damage from the Macondo disaster; all the deep-water drillers were burdened with high debt and lost substantial TSR in the Fall stage as oil companies drastically cut exploration drilling.
Offshore engineering and construction
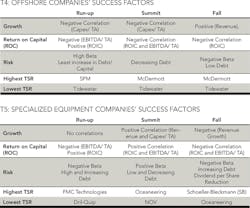
In the Run-up period, Offshore companies' TSR was strongly and negatively correlated with investment in equipment, with returns on capital and with change in total debt levels but positively correlated with average overall debt level, implying that companies with highest TSR took advantage of financial engineering opportunities to lower margins and returns on capital by refinancing debt. In the Run-up period TSR was strongly correlated with beta, suggesting investor comfort with risk. In the Summit period, TSR correlation with total debt turned strongly negative. In the Fall period, TSR was positively correlated with revenue growth (least erosion in revenues) and dividend per share growth, but not correlated with beta. So Offshore companies' TSR drivers echoed those of the contract drillers, with financial engineering during the Run-up leading to lower returns on capital and higher debt, growth in the Summit period, and shrinkage in the Fall (See Table 4).
In the Summit stage, there was very small differentiation in TSR between the offshore contractors. McDermott consistently reinvested least capital and reduced debt through the Run-up and Summit stages, encumbered in the Fall stage with lowest debt and delivering least value erosion. Tidewater, with a large investment in the highly competitive and undifferentiated supply vessels business, delivered lowest TSR in the offshore segment with 60% value loss in the Fall stage.
Specialized equipment providers
In the Run-up period, equipment company TSR was positively correlated with total debt and with increase in debt, again suggesting a positive response to financial engineering. TSR showed a strong negative correlation with Beta. Correlation with ROC over the Run-up period was mixed: positively correlated with ROIC and strongly negative with EBITDA/ Total Assets (TA). In the Summit period, TSR was positively correlated with ROC by both measures and with investment in organic growth. While both average total debt and change in debt were negatively correlated with TSR. In the Fall period, TSR was negatively correlated with revenue growth, returns on capital (by both measures) and beta, implying a need to shrink the business, lower returns and take on more debt to survive the downturn (See Table 5).
FMC Technologies delivered highest ROIC and highest TSR in the Run-up; Oceaneering consistently reinvested more strongly than its rivals and delivered high revenue growth and high EBITDA/ Total Assets returns in the Summit stage, to lead rivals in TSR. However, continued relatively high capital spending by Oceaneering in the Fall resulted in most value loss. Schoeller-Bleckmann produces differentiated non-magnetic drill-string components and downhole tools which enable data transmission from the well-bore. It is traded on the Vienna stock exchange which may, along with its differentiated products, shield it from some of the volatility challenging its more broadly traded rivals.
Conclusions
There were significant changes in business models adopted by the OFS sector during the cycle: in the Seismic segment, TGS delivered best TSR after the Run-up by successfully adopting an "asset light" model that allowed more flexible adaptation to the changing business cycle, with the focus on its seismic library, processing and visualization rather than on the equipment required to acquire the seismic data. The offshore drilling and offshore construction segments, under pressure from activist shareholders, increased debt leverage and lowered required returns on capital. This structure worked during the Summit, but was not robust to the Fall.
HP took a risk in investing in new high horsepower onshore rigs early in the shale boom. It became the preferred provider for horizontal wells in tight rock, took market share from Nabors Industries and delivered sector leading TSR in all three stages of the cycle. Halliburton was already the leader in pressure pumping when the shale phenomenon began, showed commendable financial discipline. was segment TSR leader in the Run-up and Summit stages and was close behind Schlumberger in the fall.
The other lessons seem to be that high capital spending and high debt are hazardous in a cyclical industry unless the spending provides a differentiated product ahead of its rivals in anticipation of buyers' needs, such as achieved by Helmerich and Payne. Higher debt may lower the cost of capital in the good times, but cannot be sustained in the Fall.
Companies that provided highest TSR in their segment in at least two stages of the cycle have learned to "see around corners" and adapt their strategies to changing cycle stages, invest wisely in developing new products addressing emerging needs in advance of rivals, maintain low debt relative to segment norms and position themselves as low risk relative to their peers. There is much to learn from studying them closely.
Since this research was completed, two of the equipment manufacturers have been acquired: Cameron by Schlumberger and FMC Technologies by Technip. Further, GE Oil & Gas has merged with Baker Hughes. Schlumberger has signaled its firm belief that there needs to be substantial consolidation throughout the OFS sector to reduce the excessive number of providers and allow standardization, simplification and reduced complexity in major oil and gas development projects. Oil and gas companies have in the past been skeptical of the presumed benefits and concerned about potential dependence on fewer suppliers with market power.
The conclusions of our previous article on the drivers of value in the upstream sector apply as well to the OFS sector. The most likely scenario is that the business environment will remain hostile through the early 2020s: occasional surges in prices will be extinguished by premature investment in new production. However, the duration of the next Grind stage seems more likely to be five years rather than 15 years. The likely recipe for shareholder value creation will look like the 1990s playbooks and like the success factors identified for the Fall stage of the current cycle:
Returns on Capital will be the primary driver of shareholder value: harnessing new technology and embedding it in streamlined workflows is a key enabler.
High ROC will generate sufficient cash to satisfy secondary drivers: sustaining dividends and healthy reinvestment in organic growth without increasing debt ratio.
There will be an active M&A market as well as a steady stream of bankruptcies. Companies with strong balance sheets will be able to acquire new products and services at lower than the cost of developing them.
Leaders will need to be vigilant in "looking around corners" for convincing evidence of a point of inflection that signals a return to a new Run-up in prices, starting a new cycle that will require a shift towards more aggressive growth, with reduced emphasis on dividends and debt. However, there will be false dawns and leaders should be wary of expanding too soon, losing capital discipline and running up debt that is not sustainable through market dips.
Over the next five years the big question is whether the OFS sectors will consolidate within the current segmentation or into a few monolithic entities with a full suite of products and related services from exploration through decommissioning.
ABOUT THE AUTHORS
Chris Ross ([email protected]) is an executive professor of finance at the CT Bauer College of Business at the University of Houston. He has authored numerous articles on the oil and gas industry and is co-author of Terra Incognita: A Navigation Aid for Energy Leaders. He chairs the Oil and Gas Policy Subcommittee of the Greater Houston Partnership, and sits on the Program Committee of the Offshore Technology Conference. Ross began his career with BP in London. In 1973 he joined Arthur D. Little, and moved to Algeria where he managed a large project office assisting SONATRACH with commercial challenges in oil and LNG and advising on OPEC issues such as price coordination, price indexation, and production quotas. In 1978, he moved to the ADL headquarters in Cambridge, MA and on to Houston, where he opened the ADL office in 1982. From then until 2010 he led the Houston energy consulting practice which was acquired by Charles River Associates in 2002. As a consultant, Ross works with senior oil and gas executives to develop and implement value creating strategies.
Vikram Enjam ([email protected]) is an MBA candidate with a focus on energy at the University of Houston's CT Bauer College of Business. He has more than eight years' experience in the LNG industry. He holds master of engineering and bachelor of technology degrees in mechanical engineering from Lamar University (Texas) and JNT University (India), respectively.
