The call on shale
How much the shale production must grow if supply is going to balance demand
LESLIE WEI, RYSTAD ENERGY
THE SHALE REVOLUTION was a contributing factor to the oil price collapse in 2014. During the period 2013-2015, North American shale production grew by ~1.5 million bbl/d per year. These volumes along with the results from the 2010-2014 investment cycle caused global supply to grow faster than demand in both 2014 and 2015. Going forward, shale is speculated to be the limiting force in the growth of the oil price as it responds quickly to higher prices. However, by studying the sources of new production in the medium term, it is clear that shale is the only source of production that can add the necessary volumes for supply to keep up with demand.
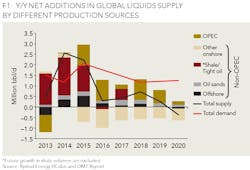
Figure 1 shows the Y/Y net additions in global liquids supply by source of production along with Y/Y global liquid supply and demand. In 2013, shale was the only source that added volumes, which compensated for the decline in offshore and OPEC volumes. In 2014, shale production continued to grow, while other sources, mainly offshore, also started to add volumes. In 2015, shale and offshore continued to grow, and OPEC joined the ranks as the sanctioning against Iran was lifted.
The strong production growth in shale ended in 2016 as production finally slowed following lower activity levels. In 2017, while global supply is still considerably lower than the growth in demand, shale production is expected to grow by 0.5 million bbl/d. To illustrate the growth in supply and demand without changes in shale volumes, Figure 1 excludes any future changes for shale production after 2017. From this, it becomes clear that without shale, the supply will not be able to keep up with demand, despite production growth from OPEC. Another way to illustrate this is to estimate how much the shale production must grow if supply is going to balance demand. This is also referred to as the "call on shale."
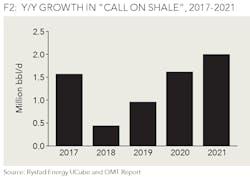
Figure 2 shows the necessary yearly growth in shale production to balance supply and demand from 2017 to 2021. To achieve this, shale has to grow by 1.6 million bbl/d in 2017, and more than 2 million bbl/d in 2021. This implies a total shale oil production of 14.1 million bbl/d in 2021. To achieve such growth in shale production, the number of spudded shale oil wells has to reach ~20,000 wells in 2021, or two times the number of spudded wells in 2016.
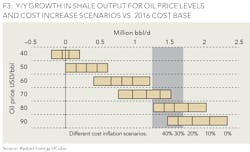
Figure 3 shows the estimated Y/Y growth in North America liquids shale production for different WTI oil prices and cost inflation scenarios compared to 2016 cost levels. The "call on shale" highlighted section represents the 1.3 million bbl/d average taken from Figure 2. The key assumption for this analysis is that exploration and production companies will balance the investments with operational free cash flow (cash neutrality). For example, in a 70 USD/bbl oil price range, cost inflation within the range of 0% to 25% is required to meet the 1.3 million bbl/d Y/Y growth in the "call on shale." In a 50 USD/bbl scenario, the liquids production may only grow as much as 0.5 million bbl/d on a yearly basis even if the costs remain flat. To reach the call on shale of a yearly growth of about 1.3 million bbl/d, the oil price needs to move into the range of 70 to 80 USD/bbl for the companies to stay cash flow neutral.
As shale is the main sources of new production in the medium term, shale production must come back to historical growth rates if global liquid supply is going to keep up with demand. To achieve this, activity has to increase considerably over the next years, and to finance this growth, oil prices need to increase again.
ABOUT THE AUTHOR
Leslie Wei is an analyst at Rystad Energy. She holds a masters of Economics degree from the University of California, Santa Barbara, and a bachelor's degree in Economics from Pennsylvania State University. Wei's responsibilities include analysis of unconventional activity in North America.


