North American Shale breakeven prices
What to expect in 2017
SONA MLADA, RYSTAD ENERGY
THE YEARLY DROP in breakeven prices across North American shale plays is likely to bottom in 2016. Understanding the drivers behind the continuous decrease in breakeven prices is crucial in forecasting the impact in 2017 and beyond. This article examines how the breakeven prices developed both on the wellhead level and on the acreage level, as well as how much of the observed reduction is sustainable in the future.
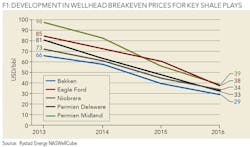
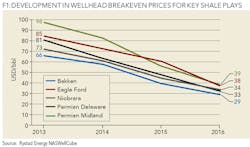
Since 2013, the average wellhead breakeven price (BEP) for key shale plays has decreased from US$80/bbl to US$35/bbl. This represents a decrease of over 55%, on average. As Figure 1 indicates, the wellhead BEP decreased across all key shale plays, with the Permian Midland experiencing the largest decrease, falling by over 60% from US$98/bbl in 2013 to US$38/bbl in 2016 (for horizontal wells only). Due to a higher average royalty, different decline profile and hydrocarbon split, the Eagle Ford experienced one of the highest wellhead BEP among the main shale oil plays in 2016.
There are several reasons behind the observed drop in BEP. The drop is partly attributable to structural changes such as improved well performance (which can be measured by improvements in the EUR) and the improved efficiency gains (which can be measured by the effect of lower drilling and completion cost, a result of more effective operations). Another set of drivers behind the falling BEP can be referred to as plummeting oil price. With clear cycles describing the petroleum industry historically, the cyclical changes experienced from 2014 will be reverted with an oil price recovery. Among the key cyclical drivers for the shale wellhead BEP are high grading (measuring the effect of operators focusing their drilling operations in the best acreages) and lower unit and production costs.
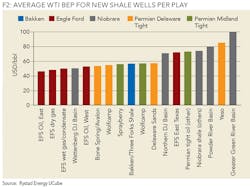
Even though the wellhead BEP is often considered the "raw" or "initial" breakeven, this is not the actual breakeven realized by the companies. If we include the effect of facility costs and the price discounts, we can compare the average acreage BEP across main shale plays, expressed in WTI price. As Figure 2 indicates, in this comparison, the different zones of the Eagle Ford Shale (EFS) – namely the East Oil zone, Dry Gas zone and Wet Gas/Condensate zone, have lower WTI BEP compared to the Permian Delaware's Bone Spring/Avalon or Wolfcamp formations. Note that the differences between the WTI BEP and the wellhead BEP are play-specific and can be within the range of 10-15 dollars.
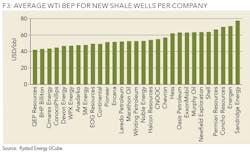
Among the shale companies with the lowest average BEP (expressed in WTI) for new shale wells, QEP Resources scores as the company with the lowest BEP (see Figure 3). This is driven primarily by the low BEP in the company's Bakken Shale acreage, particularly in the South Antelope Area. ConocoPhillips scores as the major company with lowest BEP, driven by the acreage in the East Oil zone of its Eagle Ford acreage. Some Permian-focused companies, e.g. Concho Resources or Energen, have relatively high BEP compared to their peers. For both operators this is a result of a high BEP for Wolfberry operations in the Permian Midland Basin.
Even though the BEPs have fallen across the shale plays due to the factors described, the most important question to answer is how much of this change is sustainable. Rystad Energy studied and quantified the different cyclical and structural drivers of the changing BEP and arrived at the conclusion that if all of the cyclical effects are reverted when the oil price starts recovering, the BEP might grow by 62% over the next couple of years for US shale plays.
As we enter 2017, it is important to look into whether the shale operators are ready for a growth in the current year. Activity-wise, in the main shale oil plays (EFS, Bakken, Permian and Niobrara), there are approximately 335 horizontal rigs drilling currently. This represents a nearly 100% increase compared to the bottom rig count in May 2016 at 168 Hz rigs for the same plays. While in the Bakken play the rig count has somewhat stabilized and remained relatively flat over the past couple of months, we have observed a growing trend in the Eagle Ford Shale over the last weeks of 2016. For both plays, however, the total current number of rigs stands close to 1/5 of the peak that occurred in 2014. At the same time, we observe a significantly different development for the Permian plays. Here, both plays are currently at a similar level in terms of number of running Hz rigs as they were in March 2015, or about 65-70% of the peak activity from 2014.
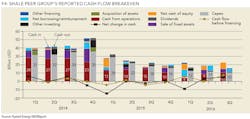
The shale operators are also entering 2017 with a more balanced cash flow from shale operations, our analysis indicates (see Figure 4). In Q3 2016 the cash flow from operations was $10 billion, with an average WTI of 44.8 $/bbl. This means that for the first time the investments did not exceed the cash from operations for the shale companies. The shale companies have been able to reduce the imbalance between cash from operations and investment from $16 billion in Q1 2015 to zero in Q3 2016 with a considerable reduction in investments. For 2017, Rystad Energy forecasts an average WTI oil price of $60/bbl, which implies a 40% improvement in the cash from operations. This improvement in the cash flow will result in higher investments by shale operators.
About the author
Sona Mlada is a senior analyst at Rystad Energy. Her main responsibility is the analysis of upstream E&P activities in North America, with a specific focus on shale asset modeling. She is the project manager for the monthly North American Shale Report, and is also responsible for analyzing global discoveries and estimating recoverable resources. She holds a degree from the University of Economics in Bratislava, Slovakia, including a graduate exchange program at Universidad de Granada, Spain.
