Shale vs. offshore
Gulf of Mexico as important as Permian Basin for US oil production
ARTEM ABRAMOV, RYSTAD ENERGY
SINCE THE EARLY DAYS of the US shale development, we have observed impressive efficiency and well productivity gains realized by E&P companies. These gains were triggered by a gradual learning process, optimization of completion techniques and well configuration, and high grading of drilling locations and equipment. In particular, the shale industry has been able to survive throughout the worst downturn in history, entering 2017 in much leaner and fitter shape. With continuous focus on unconventional development, latest trends in the US offshore are often overlooked by the market. Meanwhile, a pipeline of new deepwater projects, sanctioned prior to the downturn, lifted crude and condensate output in the Gulf of Mexico (GoM) by 400 kbbl/d over the 2014-2016 period. Based on preliminary production data, GoM produced 1.73 MMbbl/d of oil in December 2016, just 20 kbbl/d below the all-time high output achieved in September of 2009.
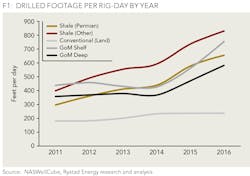
Like US shale, Gulf of Mexico development was subject to significant improvements in drilling efficiency in 2015-2016. Figure 1 demonstrates how average footage per rig-day evolved across the US in 2011-2016. The numbers are calculated as a ratio of total footage to total drilling days (including only the time from spud to total depth). Indeed, shale drilling exhibits continuous improvements due to the growing popularity of pad drilling and a shift towards high HP rigs. Permian lags two years behind other more mature shale plays as the share of test activity remains high and pad drilling remains limited, particularly in the Delaware Basin. Nevertheless, average drilling speed increased by more than 100% in the Permian from 2011 to 2016. Both shelf and deepwater development in GoM did not exhibit any signs of efficiency gains prior to 2015, with average drilling speed fluctuating in the 350-450 feet per day range. This flat development trend changed drastically in 2015-2016 when average drilling speed increased by 60-75% in the Gulf of Mexico. In the case of GoM shelf, this was achieved through severe high grading as drilling activity declined by almost 90% in 2014-2016. However, in deepwater areas, drilling activity stayed relatively flat at 25-35 wellbores per quarter (including sidetracks), indicative of the higher overall attention paid to capital discipline by E&P companies and the focus on optimizing drilling operations. It is worth mentioning that average drilling speed across conventional onshore reservoirs is significantly lower than for other activity types, as remaining conventional infill drilling is often carried out by the least efficient low HP rigs.
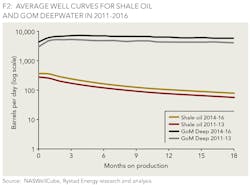
Well productivity improvements in GoM deepwater have been more significant than the recent improvements in shale. Figure 2 shows average oil well decline curves across all shale oil (Left) and GoM deep water (Right) wells in two different periods: 2011-2013 and 2014-2016. Average shale oil well productivity increased by 38% in the first 1.5 years after a well is turned-in-line from 2011-2013 to 2014-2016. The improvements were predominantly driven by the growing contribution from horizontal wells and boosted well configuration: longer laterals, more frac stages per lateral, increased proppant and fluid intensity. However, the average productivity in the first 1.5 years improved even more, by 41-42%, in GoM deep water over the same period. Significant uplift in average well productivity was caused by the high contribution to the average from several deep-water installations in 2014-2016 (e.g. Jack/St. Malo, Lucius) where a typical well produced at the rate of over 10-12 kbbl/d for more than 12 months. An average recent GoM deepwater well produced 3.6 million barrels of oil over the first 18 months.
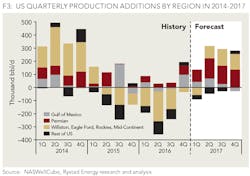
US oil production peaked in the first quarter of 2015, before entering into a consistent decline phase amid collapsing activity across major shale oil reservoirs. Figure 3 provides an overview of quarterly US oil production additions in 2014-2016 by region and an outlook for 2017. The largest cumulative decline during the downturn was delivered by the areas covering major shale liquid plays outside of the Permian Basin. Total oil output from the Williston Basin, Eagle Ford, Mid-Continent (Oklahoma) and the Rockies (DJ and Powder River basins) contracted by 830 kbbl/d from 1Q-15 to 4Q-16, declining every quarter. Another 370 kbbl/d decline came from the conventional Lower 48 fields, excluding GoM and Alaska. Only two sources of oil supply in the US remained exceptionally resilient throughout the downturn: the Permian Basin and the Gulf of Mexico. The Permian Basin's output was growing every quarter, adding 300 kbbl/d from 1Q-15 to 4Q-16. While exposed to seasonal disruptions, GoM's production was able to deliver a 240 kbbl/d growth over the same period, contributing almost equally with the Permian Basin to the limited decline pace of the total US oil production.
Recent growth in rig counts across major liquid onshore fields and the maturation of base production suggest inevitable acceleration in the pace of additions from the Permian Basin already in 1Q-17 and from other major shale plays in 2Q-17. Shale is then set to become the major source of production growth in 2017. Nevertheless, the evolution of deepwater start-up activity in the second half of 2016 positions GoM for the prolonged growth in 2017. Unless GoM faces other unplanned outages on top of the recent fire on Phillips 66's Paradis Pipeline Station, an all-time high oil output will be renewed already in the first quarter of 2017.
ABOUT THE AUTHOR
Artem Abramov is a vice president of analysis in Rystad Energy's shale well data research team, responsible for empirical analysis of well production profiles, completion techniques and economic indicators. Abramov is the product manager for the NASWellCube, Rystad Energy's NAM Shale well database. He is a co-author of the NASReport and one of the key contributors to the NAM Shale section of the OMT Report. He holds an MSc in Financial Economics from BI Norwegian Business School and a BSc in Applied Mathematics with the Major in Statistics from the Novosibirsk State University, Russia.
