Impact of downturn on shale development
Permian success story
ARTEM ABRAMOV, RYSTAD ENERGY
IN THE BEGINNING of the recent downturn (2H 2014 - 1H 2015), a general consensus in the market had been calling for a rapid collapse of the US shale oil industry. Contrary to this belief, the industry was able to survive throughout the downturn. Indeed, total shale oil production declined by approximately 700 thousand barrels per day from March 2015 to September 2016. Nevertheless, given numerous efficiency and productivity gains accompanied by lower service prices, the most dedicated shale operators have been able to complete a successful transition into low-cost source of supply with sustainable activity in a sub-60 USD/bbl oil price environment. There is no doubt that the Permian Basin provided a major contribution to this transition, showing the earliest and steepest recovery in new drilling activity since mid-2016.
Figure 1 provides a summary of key average well configuration, completion intensity and productivity metrics for horizontal wells in the Permian Basin and the rest of US shale oil (major contributors to the latter are Bakken, Eagle Ford, Niobrara, SCOOP and STACK). Average figures for 1Q 2014 and 1Q 2017 are shown in Table 1.
As the share of held by production (HBP) drilling was gradually reduced over time, operators were able to switch to longer laterals. An average perforated lateral in the Permian Basin has reached a length of 7,551 feet by 1Q 2017. The Delaware platform keeps pushing the basin average downwards as many operators are forced to drill 5,000-6,000 feet laterals due to the lease size constraints and scattered acreage positions. Significant further potential for longer laterals exists in the Permian Basin.
Nevertheless, given better infrastructure for proppant, water, and chemical logistics, wells in the Permian Basin exhibit higher sand and fluid loading than in other plays on average. An average proppant intensity in the Permian is observed at 1,927 pounds of sand per foot in 1Q 2017, while total fracking fluid volume per well is almost twice as high as in other plays, on average.
Back in 1Q 2014, a typical well in the Permian Basin showed lower oil productivity than in the rest of US shale, both in terms of initial 30-day potential and estimated ultimate recovery. This changed by 1Q 2017. Current Permian completions are now expected to deliver 553 thousand barrels of oil-25% higher than the average of other plays.
The changes in well design, choice of completion techniques, materials, and fluids, along with generally lower service prices, imposed significant downward pressure on the breakeven prices for new wells throughout the downturn.
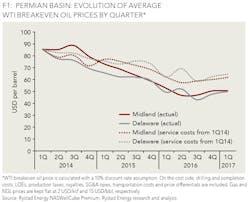
Figure 1 summarizes the evolution of average WTI breakeven oil prices by quarter in Permian Midland and Delaware. Bold lines show actually realized breakevens, while dotted lines correspond to expected average breakevens assuming no changes in service costs from the levels observed in 1Q 2014.
Driven by a combination of high-grading, efficiency gains, and service pricing, WTI breakevens decreased by almost 50% from early 2014 to mid-2016. Some reversion was observed in 4Q 16 and 1Q 17 due to the first evidence of growth in service costs and revived activity in the non-core parts of the basin. An average horizontal well in the Permian Basin exhibits a WTI breakeven price of 50 USD/bbl as of early 2017.
The dotted lines indicate that breakeven prices would have improved within the considered time frame even if no cost deflation was observed. Using average service costs from 1Q 14, a meaningful reduction in breakevens can still be observed in both Midland and Delaware from the level of 85 to 60-65 USD/bbl by 1Q 2017. This illustrates that service costs accounted for only 30-40% of breakeven price improvements in the Permian Basin, while the remaining was due to high-grading and efficiency gains.
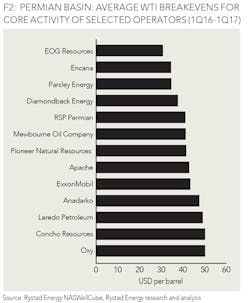
While average WTI breakevens in the Permian are observed at 50 USD/bbl as of 1Q 2017, the majority of dedicated operators have been able to achieve sub-50 breakevens within their core acreage positions since early 2016. Figure 2 shows average breakevens for the selected largest operators in the Permian Basin (both Delaware and Midland). Only horizontal wells completed in line with type well configurations in 1Q 2016 - 1Q 2017 are included. Test activity often exhibits a higher share of unsuccessful completions with less favorable well economics.
EOG Resources, Encana, Parsley Energy, and Diamondback Energy exhibit average breakeven prices below 40 USD/bbl. All other players within the peer group exhibit commercial development activity in a sub-50 oil price environment. There is a tendency of further shifts to longer laterals and more intensive completions among top operators in 2017-2018. Therefore, the net impact of increased intensity and well productivity is expected to offset a material part of the recently triggered cost inflation. A core part of the Permian Basin's activity is currently seen as a low-cost source of supply and is expected to deliver a sustainable production growth towards the end of decade.
ABOUT THE AUTHOR
Artem Abramov is a VP Analysis in Rystad Energy's shale well data research team, responsible for empirical analysis of well production profiles, completion techniques, and economic indicators. Abramov is the product manager for the NASWellCube, Rystad's NAM Shale well database. He is a co-author of the NASReport and a key contributor to the NAM Shale section of the OMT Report. He holds an MSc in Financial Economics from BI Norwegian Business School and a BSc in Applied Mathematics with the Major in Statistics from the Novosibirsk State University, Russia.


