Don Stowers, Chief Editor - OGFJ
Laura Bell, Statistics Editor - Oil & Gas Journal
Financial results for the OGJ150 group of companies were lukewarm by most measures in the second quarter of 2017. However, given the lengthy downturn that the oil and gas industry is emerging from, maybe "neither hot nor cold" isn't so bad.
In the last quarter, we suggested that 1Q17 might be considered a "turning point" for the industry when the downturn began to change direction. That still seems to be the case, especially if you compare net income and total revenue year over year with 2016. However, the latest results trended downward from the previous quarter.
Speaking of trends, "lower for longer" still seems to be a prevalent theme with regard to energy prices. Nevertheless, the Permian is still hot even with $50 oil, and there is renewed activity in gas plays like the Haynesville. As US exports of LNG start to increase, this could begin to impact domestic natural gas markets in some parts of the country, although efforts to monetize more associated gas may serve to offset volume reductions achieved from LNG exports.
TOTAL REVENUES
Total revenue for the OGJ150 group of companies in the 2Q17 grew by nearly $20.3 billion (17%) over the same quarter in 2016. That's certainly not bad, but it was down from the $43 billion (42%) year-over-year growth seen in the previous report. It represents an improvement over the $14.8 billion (11%) growth in the 4Q16.
However, comparing 2Q17 with 1Q17, we see a slight decline - $5.6 billion (3%) - drop in total revenue. This may be insignificant, but we'll have to see what happens in the third quarter. I believe this is called "watchful waiting."
Here is a quick look at total revenue for the group for the past 11 quarters:
• 2Q17 - $137.5B
• 1Q17 - $143.1B
• 4Q16 - $128.3B
• 3Q16 - $127.7B
• 2Q16 - $117.3B
• 1Q16 - $100.2B
• 4Q15 - $123.9B
• 3Q15 - $145.5B
• 2Q15 - $159.3B
• 1Q15 - $145.2B
• 4Q14 - $198.1B
As you can see, total revenue for the group bottomed out in the first quarter of 2016 and has improved incrementally in subsequent quarters, until the most recent quarter. Current revenues are still approximately $60 billion less than in the fourth quarter of 2014, just 10 quarters earlier.
NET INCOME
As with the total revenue figures, net income for the group was up substantially - $3.2 billion in the 2Q17 compared to a net loss of $17.1 billion in 2Q16. However, there was a precipitous drop from $9.9 billion in the prior quarter to $3.2 billion in the second quarter. This represents a 67% decline in net income. Is this an anomaly or a symptom of a problem with fundamentals? Obviously this is something to watch in the next quarter.
Here is a glimpse at net income figures for the group for the past 11 quarters (brackets indicate a net loss):
• 2Q17 - $3.2B
• 1Q17 - $9.9B
• 4Q16 - [$17.5B]
• 3Q16 - [$1.0B]
• 2Q16 - [$17.1B]
• 1Q16 - [$18.9B]
• 4Q15 - [$58.5B]
• 3Q15 - [$47.3B]
• 2Q15 - [$28.5B]
• 1Q15 - [$15.2B]
• 4Q14 - $2.5B
The good news is that the OGJ150 group is on a two-quarter winning streak. The forecasters who predicted a return to profitability this year, after eight consecutive quarters of net losses, have been proved correct.
EXXON STILL ON TOP
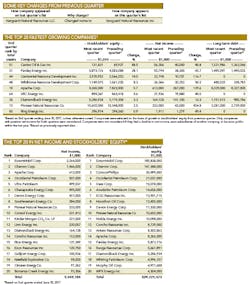
Among the top companies in net income, ExxonMobil still reigns supreme. The supermajor realized nearly $3.3 billion in net income for the 2Q17 compared to $4.1 billion in net income for the 1Q17 and $1.7 billion year over year. No. 2-ranked Chevron earned almost $1.5 billion in net income for the quarter compared to $2.7 billion the prior quarter and a net loss of about $1.5 billion year over year.
The rest of the top 10 in net income includes:
• Apache Corp. - $613M
• Occidental Petroleum - $507M
• Ultra Petroleum - $499M
• Chesapeake Energy - $495M
• Devon Energy - $451M
• Southwestern Energy - $284M
• Pioneer Natural Resources - $233M
• Consol Energy - $227M
New to the top 10 income list this quarter are Apache Corp., Occidental Petroleum, Ultra Petroleum, Chesapeake Energy, Pioneer Natural Resources, and Consol Energy.
The following companies dropped off the list of Top 10 in net income: Linn Energy ($220M); Chaparral Energy ($21.4M); Concho Resources (net loss of $63.6M); ConocoPhillips (net loss of $3.4B); Stone Energy (net loss of $6.5M); and Antero Resources (net loss of $5.1M).
Of the top 20 companies ranked by total assets, nine showed net losses for the quarter: No. 3 ConocoPhillips, No. 4 Anadarko, No. 7 Hess Corp., No. 9 Marathon Oil, No. 11 Noble Energy, No. 13 Antero Resources, No. 14 Continental Resources, No. 19 Murphy Oil Corp., and No. 20 Whiting Petroleum Corp.
TOP 10 IN TOTAL REVENUE
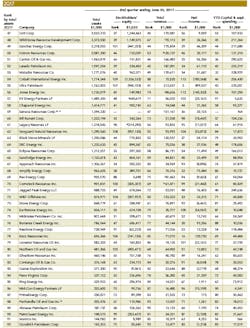
ExxonMobil again leads the pack with $63.3 billion in total revenue, virtually the same as in the previous quarter. Chevron remains No. 2 with $34.5 billion, up from $33.4 billion in the first quarter.
The remainder of the top 10 in total revenue includes:
• ConocoPhillips - $8.9B
• Occidental - $3.6B
• Devon - $3.3B
• Anadarko - $2.7B
• EOG Resources - $2.6B
• Chesapeake Energy - $2.3B
• Pioneer - $1.6B
• Apache Corp. - $1.4B
TOP 10 IN SPENDING
(YEAR TO DATE)
ExxonMobil moved past Chevron in spending in 2Q17 with $6.8 billion in capital spending in 2Q17. Chevron fell to the No. 2 position with $6.5 billion in spending.
The rest of the top 10 in spending includes:
• Anadarko - $2.3B
• ConocoPhillips - $2.0B
• EOG Resources - $1.9B
• Occidental - $1.5B
• Devon - $1.5B
• EQT Production - $1.4B
• Noble Energy - $1.2B
• Pioneer - $1.1B
YTD CAPITAL SPENDING
Year-to-date capital spending in the second quarter of this year stood at about $46.1 billion, down approximately $3.9 billion (7%) from year-ago levels. As a further indication that companies continue to spend less even as oil prices and profitability climbs, this represents a dramatic 47% decline from 2Q15 capital spending - two years ago - which was just under $50 billion.
MARKET CAPITALIZATION
The top 10 companies in market capitalization as of June 30, 2017, are: 1) ExxonMobil ($342.1 billion); 2) Chevron ($197.7 billion); 3) ConocoPhillips ($53.5 billion); 4) EOG Resources ($52.3 billion); 5) Occidental Petroleum ($45.8 billion); 6) Pioneer Natural Resources ($27.1 billion); 7) Anadarko Petroleum ($26.5 billion); 8) Concho Resources ($17.7 billion); 9) Apache Corp. ($17.3 billion); and Devon Energy ($16.8 billion).
FASTEST-GROWING COMPANIES
For the second consecutive quarter, we have a short list of "fastest-growing companies." Ranked according to growth in stockholders' equity, these were the fastest-growing oil and gas producers in the 2Q17:
• Carrizo Oil & Gas Inc. grew by 88.5% over the preceding quarter
• Parsley Energy Inc. grew by 28.1%
• Centennial Resource Development Inc. grew by 14%
• WildHorse Resource Development Corp. grew by 8.3%
• Apache Corp. grew by 5.7%
LIST GROWS A BIT
By press time for this issue, 117 of the 137 companies included in the OGJ150 Quarterly Report had reported their financial results to the US Securities Exchange Commission. This is up from the 104 of 124 companies that reported their results in the prior quarter.
KEY CHANGES
The only notable change in the OGJ150 for this quarter: Vanguard Natural Resources LLC changed its name to Vanguard Natural Resources Inc.
Click here to download the PDF of the OGJ150 Quarterly "Quarter ending June 30, 2017"


