Oil price increases, yield curve inversion may be indicators of economic recession
Judah Rose and Dr. Sunita Surana, ICF International, Fairfax, Va.
The purpose of this article is to examine the utility of relatively simple rules-of-thumb for forecasting US economic recessions. These rules-of-thumb are directed primarily at non-economists who do not have access to more sophisticated tools such as large computer-based macroeconomic models. A revisiting of this issue is appropriate in light of: (1) the depth of the current recession, (2) the extent to which it was largely unanticipated, and (3) the key role of energy prices in causing and exacerbating the recession.
Our focus is on the examination of the following highly observable economic variables as predictors of recessions: (1) crude oil prices as an index of energy prices, (2) the sign of the slope of the yield curve, especially yield curve inversion, and (3) composite indices of leading economic indicators. We conclude that, based on historical experience, a combination of crude oil prices and yield curves provides a simple rule-of-thumb that has reliably signaled the imminent onset of recessions and also predicted their intensity.
We also make observations about the prospects for national energy and climate policy initiatives to end or weaken the relationship between oil and the macro-economy. Our conclusion is that energy policy could have the effect of weakening the relationship between oil prices and the economy, but it will likely not happen soon. Hence, the relationship between energy and economic cycles appears likely to endure.
US economic recessions since 1973
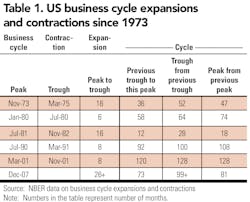
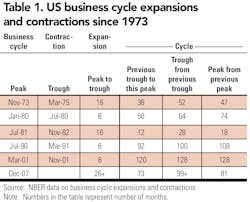
Since the first oil crisis of 1973, the US has experienced six recessions of varying lengths and severity (see Table 1). The primary focus of our analysis will be these recessions. This is because of the emergence of oil and energy as key determinants of economic cycles.
Oil price increases as a predictor of recessions
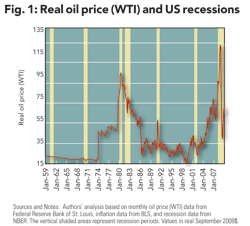
The recent run-up in the price of crude oil preceded the current recession. In fact, several years of oil price increases precipitated the start of the current recession in December 2007 (see Figure 1). Even more dramatically, within a few months of crude oil reaching an all time peak in the spring of 2008, the economic crisis of Fall 2008 occurred. The figure also shows that all recessions since 1973, including the most recent one, are associated with and preceded by crude oil price increases.
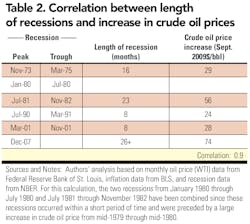
In another perspective on this relationship, the biggest annual increase in real oil prices was followed by the largest recession since World War II. In addition to the occurrence of recessions being associated with oil price increases, the severity of the post-1973 recessions are also correlated with the degree of oil price increases. As shown in Table 2, there is a 0.9 correlation between the extent of the increase in oil prices and the length of recessions.
Oil price increases as a cause of recessionsk
The primary focus of this article is on correlation. We do not offer a detailed explanation of the workings of the US and world economies and how oil and energy affect the economy. However, we do believe that there are very plausible reasons for believing that oil and energy are drivers of economic cycles, and this contributes to our willingness to recommend reliance on the oil price metric.
The three reasons why we find it plausible that energy in general, and oil in particular, are so important in predicting economic cycles are: (1) depressive income effect after a spike in energy expenditures; (2) uncertainty accompanying oil price increases; and (3) constraints on monetary policy due to oil and energy developments.
The first argument is compelling. The large depressive income effect is partly explained by the inelasticity of demand for oil. That is, consumers have little or no short-term ability to substitute other goods for oil, and instead, cut back on other expenditures. The effect is magnified by the large share of energy in the expenditures of lower income groups.
If energy prices (oil, natural gas, coal, and electricity) would have continued at the peak level of Spring 2008 for one full year, total US energy payments would have amounted to $1.8 trillion. This amount is 3.6 times 2002 levels, represents 13% of 2007 GDP, and 161% of total 2007 federal individual income taxes.
Economic uncertainty also is an important factor exacerbating the effects of oil price increases. While we now know that the spring 2008 highs in energy prices were not sustained, consumers did not know that at the time. They had to make consumption decisions accounting for all the possibilities including an even further increase in prices. This increased the extent of the pull-back in consumption. Similarly, investment decisions had to account for the uncertainty in economic and energy sector conditions.
The changes in oil prices also appear to constrain the Federal Reserve's flexibility, exacerbating the business cycle. For example, to defer the effect of an oil price increase on the economy, the Federal Reserve must take more extreme steps to stimulate the economy than if the oil markets were stable. This causes the cyclic impacts of energy to be even greater.
Figure 1 raises another question related to the importance of energy's effect on the Federal Reserve. Namely, why did the oil price increases in the 2003-2007 period not lead to an earlier recession, i.e., why did the current recession start in December 2007 rather than earlier in the 2003-2007 period?
We believe the answer is that another macroeconomic factor played a key role. In particular, the lowering of interest rates to very low levels in the early part of the decade set off a countervailing asset, housing, and mortgage bubble that deferred the effect of oil price increases. Put another way, only the Federal Reserve can forestall oil price increases from causing a recession. This segues to our next leading indicator of recessions: yield curves.
Yield curves
The sign of the slope of the yield curve as a predictor of recessions has also received some attention in economic circles. In light of our above argument that monetary policy overrode the linkage between oil price increases and the economy in recent years, the yield curve seems ripe for revisiting.
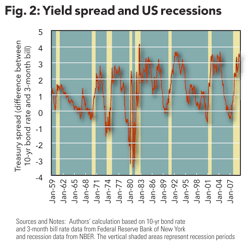
One of the most reliable and closely followed spreads is that between the long-term 10-year Treasury bond and the short-term three-month treasury bills. Using this measure, Figure 2 shows that over the last 50 years, seven of the eight instances of a negative spread between the long-term and short-term rates (all except for 1966-67) have been immediately followed by recessions. Also, all of the last six recessions, those in the post-1973 period, have been anticipated by inversions of the yield curve.
The yield curve inversion seems to be such a good predictor of recessions that one is tempted to recommend its use as the sole rule-of-thumb, especially for non-specialists. Note, however, that the yield curve inversion on its own does not provide good information regarding the intensity of the forthcoming recession. In both 2000 and 2007 there were inversions (the spread between the long-term 10-year Treasury bond and the short-term, three-month Treasury bills was -0.7% by end of 2000 and was -0.5% by end the of the first quarter of 2007) and there were recessions, but one was relatively mild, and the other was the longest and severest recession since the Great Depression.
Recommended synthesis: new rule-of-thumb using oil prices and yield curves
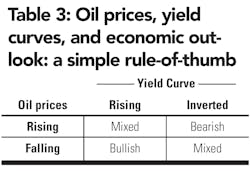
We suggest that generalists in particular consider the rule-of-thumb shown in Table 3. This matrix provides four combinations of oil prices and yield curves and indicates our assessment that these combinations lead to three different macro-economic outlooks (bullish, bearish, and mixed). At present, with positive spreads between long-term and short-term rates (i.e., rising yield curve) and crude oil off the highs of 2007-2008, the matrix is currently bullish for economic recovery. Conversely, an inverted yield curve and rising oil prices signal a recession, and the greater the oil price increase, the more severe the outlook. A mixed situation, e.g., rising oil prices and a rising yield curve, would not signal a recession, though it would heighten the watch on the yield curve to see if "the second shoe drops."
Leading economic indicators
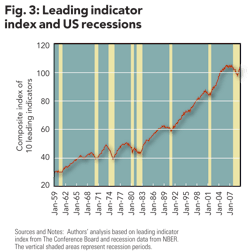
Other indicators are often used as signals of economic activity as well. Some measures typically used as leading indicators include net new orders for durable goods, consumer sentiment, etc. Figure 3 traces a composite leading index against recessions. It can be seen that while all recessions since 1970 have been preceded by a decline in the composite leading index, during the current recession the index was more coincident than leading. For instance, up until November 2007, only a month before the official start of the current recession, Economic Cycle Research Institute remarked that, many leading indexes "were not yet showing recessionary weakness." This partially explains why many observers were surprised by the onset of the current recession. Similarly, the 1960-61 recession also was not preceded by a decline in the leading index.
We also considered other indicators suggested by recent events — indicators of asset bubbles, price-earnings ratio of stock indexes, general inflation, etc. We have not found one that keeps it simple, i.e., limits us to one or two widely observable indicators easily available to non-specialists and that explains all of the last six recessions.
Why are the oil and yield curves underemphasized?
For a variety of reasons, we believe that the importance of oil prices has been underestimated, and we have some company in holding this view.
"Of the number of factors that have contributed to the slowing of economic growth in the United States over the past few quarters, the one that has received less attention than it clearly merits is the rise in energy prices. In what may or may not be coincidence, at least the last three recession periods in the United States—those of 1990-91, 1980-82, and 1974-75—were preceded by spikes in the price of oil. As a consequence, we at the Federal Reserve are especially attentive to developments in energy markets and their effects on the behavior of households and businesses. Obviously, caution is required in drawing generalizations from only three observations, and indeed many analysts do not place much credence in the link between oil prices and the business cycle." [highlights added] — Chairman Alan Greenspan (2001 speech before the Economic Club of Chicago)
This suspicion that oil prices are not adequately appreciated is also supported by the general surprise at the timing and intensity of the current recession in spite of what we have shown is a strong link between oil price increases, yield curve inversion, and the recent economic trends.
Part of this lack of emphasis is related to a conclusion of some observers, in the period leading up to the recent recession, that the relationship between oil price spikes and economic activity was weakening. One support for this was the falling energy intensity of the economy. Oil's effect on the economy is often gauged based on its share of GDP. This ratio fell as the economy grew in real terms and oil consumption growth was small. However, a large part of the decline in the share was due to the decline in real oil prices. With a sharp rise in crude oil prices, the share in 2008 was high, albeit not at 1980 levels.
The complexity of the energy sector is another factor. Oil is especially crucial because it generally drives and is correlated with the prices of other energy sources including natural gas, coal, and increasingly electricity which itself is increasingly tied to natural gas pricing. Put another way, the importance is underestimated if one just looks at oil, and not oil together with other energy sources.
Undoubtedly, as noted by Chairman Greenspan, small sample size is a problem. Even now, we have only six post-1973 US recessions. It should also be noted, however, there is significant similar non-US experience.
The continuing lack of significant excess supply in oil markets in combination with rising demand in developing countries points to the potential effect of oil remaining high for a considerable period of time.
Implications of proposed change in energy policy
Another argument against the importance of oil is that proposed policies will weaken or eliminate the relationship between oil prices and economic outlook (e.g., through the development of hybrid and electric vehicles over time and the requirement for CO2 reductions).
Economists have long proposed that one way to break the linkage between the economy and oil is to tax oil more. This would decrease usage and prices, and facilitate competition from alternative energy. While the taxing would simulate the effect of higher energy prices, this effect could be theoretically offset if the tax revenue could be used to offset the effect (e.g., income tax reduction, payroll tax reduction). However, this approach is considered politically infeasible.
One response to the infeasibility of substantially higher US oil taxes is to pursue targeted subsidies for alternative energy. There clearly are federal and state subsidies and tax breaks for alternative forms of energy including electric vehicles. On the other hand, there are over 250 million gasoline-fueled vehicles on the US market alone, and more than a billion worldwide, so new propulsion systems will take years to have a substantial impact. Thus, while proposed policies could eventually weaken the economy-energy linkage, any major changes will likely take considerable time.
Another policy that could have an impact of the relationship between energy and the economy is a CO2 control initiative such as a cap-and-trade program that would greatly reduce fossil energy use. Ultimately, the effect of any strict CO2 reduction program would be to decrease or eliminate the connection between oil and the economy. Hence, developments in this area merit continued attention.
Conclusions
The efficacy of using oil prices, together with the sign of the yield curve slope, to predict the economy have been reinforced by recent events. This relationship is likely to continue for some time. The variables are easily observable and available for non-specialists lacking access to complex macroeconomic models. While any forecast, especially one based on a simple rule of thumb, can be wrong, we advocate the following as a rebuttable presumption: one should expect a recession if the yield curve inverts and oil prices have increased over the previous one to two years, and a severe one if the oil price increase is large. Lastly, and unfortunately, when the next recession inevitably occurs, we will have another chance to revisit this issue.
About the authors
More Oil & Gas Financial Journal Current Issue Articles
More Oil & Gas Financial Journal Archives Issue Articles
View Oil and Gas Articles on PennEnergy.com
