Organized approach is key to successsful capital projects
Charles F. Gillard
Consultant
Houston
How many capital project managers have been faced with this situation: the board of directors asks you to propose a capital project to add $50 million to the company’s annual profitability? At a time when companies live from one quarterly earnings report to the next, most board members groan at the prospect of another capital project - yet at this major oil company (call it Alpha Energy), such projects are in demand.
What makes the difference? Alpha has an organized approach to project preparation that includes estimation, implementation, review of each project’s performance, a “lookback,” and review of groups of projects, “recaps,” which give senior management confidence in the ability of new projects to add to the coffers.
The primary driver of that confidence has been the lookbacks on past projects and recaps of groups of projects.
Based on my experience with more than 400 lookbacks on projects totaling nearly $2 billion, this article focuses on the lookback and recap process and the lessons learned. We present a format for lookbacks; discuss the critical elements in setting up a lookback baseline; analyze management approaches that can make a dramatic difference to ultimate project success; and conclude with advice on project selection.
Lookback and recap processes
The proof of a successful project is in the lookback. Every lookback starts with the business promise. Technical and business managers often complain they don’t get support for their capital needs, but are those managers willing to promise what the capital will deliver? And can they prove capital expenditures made in the past have paid off? Being able to answer “yes” to both of these is the key to more and better projects. No project should be undertaken without the promise of a specific return. This promise sets the baseline for the lookback.
Alpha Energy, our hypothetical company, had a discounted cash flow computer application that was required for calculating profitability for every capital project proposal. The requirements were extremely rigorous and complete, and risk-adjusted discount rates were base-loaded into the computer program. AFE requests sent in by business units that weren’t up to date on their lookbacks were returned.
The first lookback should be scheduled a year from project startup, with subsequent lookbacks at yearly intervals or where needed due to changing raw material costs, product values, etc. - all of which can greatly affect profitability.
The goal of the lookback is to compare actual project performance with initial estimates (the promise). Recaps should be done periodically - perhaps as part of annual capital expenditure planning - to determine return on total capital investment. Recaps should also include analysis of return by project type.
Lookbacks and recaps are not only a measure of past performance, they also should be used to ferret out and repair root causes of problems that impair project performance.
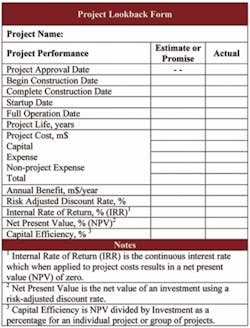
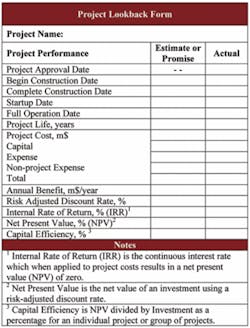
A good format for a lookback is a one-page summary (shown in Table 1) followed by the data tables, analysis and discussion. The lookbacks and recaps should provide answers to the following questions:
• Are the projects returning, on the whole, what was promised in the capital proposal?
• What is the overall return on the capital investment?
• Are the right projects being selected?
• Are the projects operationally and technically successful?
• Is the project management successful?
• What factors lead to poor performance on the projects?
Establishing a baseline
Considerable thought and planning should go into establishing a baseline that facilitates future lookbacks, particularly the first few times it is done. The key areas where we have seen baselines fall short are:
• Documentation;
• Justification and estimation; and
• Technical and operational performance.
Documentation
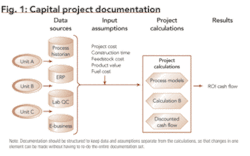
The most common problem with project documentation is that project files and calculations are typically structured only for the immediate task at hand - developing the project proposal. To structure proposal documentation for a future lookback, make sure the data and assumptions are well defined and documented, and keep them separate from calculations.
Then, when crude or product prices change, you only have to change the number in one place, and the changes propagate throughout the evaluation. Intermediate products and data elements (e.g., the price of a product that is expected to be X cents below the price of product Y) should be documented in a similar way. This is simply good engineering and the “data warehouse” principle familiar to those in operations research.
The data warehouse is simple, but it is often overlooked. The benefits are twofold: (1) in the proposal stage, it facilitates evaluation of “What if...” cases; and (2) in the lookback, it facilitates evaluation of where the project when wrong (or right).
A more serious problem in documentation is that underlying project premises - economic values, the calculations leading to them, and the logic behind them - are typically not well documented. This creates doubt about the validity of the lookback. Project premises and forecasts need to be fully documented during project development.
Justification and estimation
One of the common problems we saw in the 400-plus lookbacks was weak or vague justifications. Exactly what was being promised? It is impossible to compare the results of a project with the initial promise if you can’t tell what the promise was.
The business promise must be clear and concise, and that includes defining exactly how calculations will be done during future lookbacks. A “before” baseline must be captured so that calculations can be done both on this baseline data and on an “after” set of data, assumed or actual.
Time spent in structuring your justification during the proposal phase is time that you will not have to spend justifying why you did something later.
Project cost estimates should have a standard deviation of 10 percent or less, depending on the type of project. If you have carried your entire project through detailed design and use a rigorous front-end loading program, your estimates should be accurate to within five percent. 1 2
Technical and operational performance
Ninety percent of the projects succeeded technically and operationally. In most cases performance problems are related to:
• difficulty in measuring small changes,
• incomplete problem definition, and
• faulty assessment of technical risks.
Difficulty in measuring small changes
Small changes in unit feed rates or yields can often achieve very high returns at a low cost - but verifying the small change is difficult. It is crucial to set up a good baseline in advance and identify the exact analysis method for measuring the actual change. Then continue to track the baseline during project implementation to make sure you are on track.
Some small changes can’t be verified. If you have a new computer program that saves 1,000 people five minutes a day, you probably will not see a difference in your bottom line. Perhaps the project should not be proposed. On the other hand, if you have a program that helps clerks process 55 invoices a day instead of 50, you now have something you can measure. It’s also important to let employees know that you will be measuring.
Faulty assessment of technical risks
Projects in which substantial technical or operational risks are recognized and addressed nearly always work. It is the “low risk” projects that are more likely to turn out poorly - the biggest risk is an unrecognized one.
For risk assessment to work well, managers must be familiar with technical issues, and they must communicate well with the technical staff. If decisions are being made about whether or not to spend the time to run stress tests, you want to know about it. If people are deciding to buy equipment from an unproven vendor because it’s cheaper, beware. And if you hear, “Nobody ever built one this big/hot/pressurized before,” you might question whether you want to be the first.
Risk reduction projects pose unique problems: what do you use for a baseline? You must estimate the probability of a risk occurring (Is the control equipment nearing the end of its projected life span? Are there data to show an increasing failure rate for the instrumentation?) You must also estimate the cost of an event if it does occur (unit shutdown?).
Be aware that perception of risk is highest immediately after an occurrence and decreases with time. People also tend to underestimate the risk mitigation that can be achieved through procedural or operational adjustments. Don’t necessarily rush to implement a project. Investigate low-cost options first. Finally, recognize that you cannot spend your way to total risk-elimination. Ultimately, only the knowledge, attention and skill of the people can provide incident-free operation.
When developing and evaluating risk reduction projects, consider additional benefits that may be realized - the instrumentation replacement may make it possible to reduce operations staff. It will probably reduce maintenance and may decrease fuel use. And if it can increase unit throughput, you’re really in business. By taking credit for these benefits, and possibly changing project design to increase them, you might turn a marginal project into a “must have.”
Managing change
Now you have a well-thought-out project, solid documentation and a good baseline for future lookbacks. How can you manage the change so that it will succeed and your lookbacks will be hero stories?
Here is one example of effective change management, though it never made it to a corporate lookback: As manager of the unit, I was looking for another 1,000 barrels per day in the coker. When I visited with the coker the control room, they told me they needed a new, soft, floor - the old, hard floor, was killing their feet. I said, “OK You’ve said you want a soft floor, and I hear you. Now it’s your turn to ask me what I want.”
When they did, I said that I wanted 1,000 barrels a day in the coker, and did they think it was possible? I then hired a flooring contractor and paid him to measure the floor four times, once for each shift, and to tell the operators what he was doing. I wanted them to know we were listening.
By the time the contractor finished measuring, we had broken through the 24-hour coke drum cycle mentioned above (Remember the better nozzle?) and had 3,000 BPD more in the coker. We were making $30,000 more each day. The one-time cost for the floor was $20,000.
This example might not be “by-the book,” but it worked and makes the point. If you are spending $7 million on a control room consolidation, throw in another $60,000 for new showers and a locker room. Bring this out in communication sessions with the operators - along with the cost saving justification for the project - and you have just improved the probability of success of your $7 million project by about 50 percent.
Think about it: do the operators really care about improving company profitability? What they want to know is “Will you air-condition the break room? Will we get a lunch room with a Coke machine?”
Tracking probability
Recognize that profitability varies dramatically from year to year. Product demand, prices, fuel costs, and other variable costs change on a monthly basis, and all can impact your project’s return on investment. Actual project performance over time is always different from predicted (better or worse) in the ROI calculations.
If your project looks bad in the lookback and your reputation is at stake, you will analyze data like never before. Be prepared for it in advance and save yourself a lot of grief. In extreme cases you may have to recalculate project payouts for several years until the variability averages out.
The greatest contributor to disappointment is business uncertainty. To help compensate for this, you may want to add sensitivity analysis or stochastic modeling (Monte Carlo simulations) to your project analysis. Sensitivity analysis gives you a quick look, while probabilistic models (Monte Carlo simulations) calculate the probability distribution curve for various outcomes. 3
Choosing projects
One key to successful projects is choosing the right projects to start with. Build a list of as many projects as possible (this is like diversifying your stock portfolio), and then look at the ROI and failure rates from different types of projects using lookbacks and recaps.
In general, projects that increase capacity have the highest benefit. A project that increases capacity and also improves yields or decreases operating costs or increases run length or decreases maintenance cost, is a winner in almost any economic scenario. If you can’t get a return based on demand for the product, then you can save energy costs by reducing yields. Projects with multiple benefits should go to the head of the list.
Many times a single-benefit project can be altered to a multi-benefit project for a very small incremental cost, and this is almost always a good decision. If you have to change out a pump and motor, why not add capacity, reliability and efficiency at the same time?
Finally, keep in mind that competition is good. Having a list of profitable projects substantially longer than the capital budget should not be seen as discouraging but as an opportunity to select the most advantageous projects. Competition fosters more critical review and strengthens efforts to improve cost/benefit ratios.
Ideally, you should have twice as many projects on the list than can be funded. Put mandatory projects at the top of the list, include 5 to 10 percent of social projects (locker rooms and landscaping), and carry over the losers for consideration next year.
Conclusion
Looking back on capital projects leads to valuable lessons on project selection, design and management, as well as information about the types of projects most likely to succeed. Lookbacks and recaps help improve project performance and capital efficiency, which increases management confidence and ultimately makes more capital available.
For the lookback/recap process to succeed, you need a solid baseline where data is well documented and kept separate from the calculations. You need to start each project with a promise, not a premise. You need to manage change with respect for the people you will ultimately depend on to meet the promise OGFJ.
References
1. Construction Industry Institute (www.construction-institute.org), Project Definition Rating Index (PDRI), Industrial Projects, IR113-2
2. IPA - Independent Project Analysis (www.ipaglobal.com)
3. Jonathan Mun, Applied Risk Analysis (John Wiley & Sons), 2004
The author
Charles F. Gillard [[email protected]] is principal of C. F. Gillard and Associates, Houston. His in-depth knowledge of project development and management was developed during his 35-year career at Shell Oil Company, where he held a variety of operations, engineering, and information technology positions. Gillard finished his Shell career as vice president, continuous productivity improvement and CIO at Shell Deer Park Refining Company. He holds a bachelor of science degree in chemical engineering from Purdue University, West Lafayette, Ind.


