Backwardation in the market
Challenges of a backwardated crude forward market
Keith Barnett, Asset Risk Management, Houston
The current combination of steeply backwardated crude oil markets and historically low volatility is creating a tough environment for producers who need to lock in forward prices to satisfy their enterprise value protection, capital provider requirements, or cash flow needs for drilling programs. Backwardation in the crude market is likely to persist indefinitely, which leads to the increasing need for producers to establish their view of how absolute prices and the shape of the forward curve will move over time. This article examines 1) why backwardation occurs; 2) how a persistent backwardated market impacts hedging outcomes; 3) factors that are likely to flatten the curve in the future; 4) impacts to hedge/prices as a flatter curve steepens again in backwardation and 5) what proactive implementation steps a producer needs to take in their hedging program. Asset Risk Management (ARM) believes some degree of backwardation will persist in the market for the indefinite future. We believe this heightens the need to extract value from the market whenever it gives opportunities to find value in price fluctuations, curve shape changes, options structures, and other basic dynamic reactions to market moves.
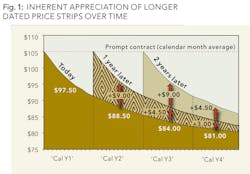
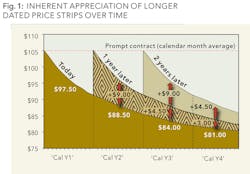
Both Brent and WTI are relatively steeply backwardated. Currently July WTI is trading at $102.80 and Dec-2014 is $98.29 for a five-month spread of $4.69. Three years further out the curve Dec-17 is $84.77 another $13.52 per barrel lower realization. Brent is similar with July priced at $108.92 with Dec-14 at $106.07 for only a $2.85 per barrel decline. Likewise, Brent Dec-17 is $96.22 for an additional $10.15 decline. Figure 1 shows illustratively what happens as a relatively steeply backwardated market "rolls" forward through time and long dated months become prompt. When this phenomenon persists the risk is a producer can "freeze" their hedging activities out of concern that their hedges will settle lower than the appreciated market price. ARM can assist producers in establishing market views and strategies that minimize this risk while maximizing the retention of enterprise / balance sheet value.
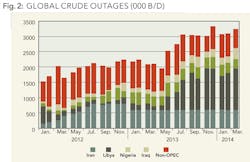
Why is crude oil so backwardated and what might cause it to flatten or even go contango shape in the future? In classical analysis of nonperishable commodity markets the normal shape of the forward curve is contango, where each subsequent month is higher priced than the previous month. This represents the cost of storage (including cost of carry) for a stable supply demand picture. Leading traders / market commentators like Dennis Gartman of the internationally known Gartman Letter would characterize backwardated commodity markets as a market that is fundamentally bullish. Backwardated markets are saying we need the commodity now, don't store it; deliver it. At the same time, shifts in the degree of backwardation when the term structure narrows is a bearish "sign" and if it widens it is a further bullish "sign". We do not believe crude is in short supply with rapidly growing North American production and high inventories in the US combined with average inventories across the world. However, the persistent outage of 3+ million barrels of global crude from sources like Syria, Iran, Nigeria, etc. continues to provide a strong geopolitical "bid" into the crude market. Higher average refinery utilization in the Americas combined with increasing product exports is keeping the WTI physical market from experiencing an oversupplied condition.
One key driver that we believe supports the front end of the curve is the influx of commodity index fund money which is heavily weighted towards Brent and WTI crude oils. Goldman Sachs's GSCI™ commodity index weighted WTI for 31% and Brent for 18.4% of total commodity holdings for 2013 the last year the data is readily available, while Bank of America Merrill Lynch Commodity Index for 2014 is 29% Brent and 4.7% WTI. There is a range of estimates for the amount of money placed in these index funds, but conservatively they range upward from $40 billion. Since these are "long only" funds, they put a constant buying pressure on the front end of the crude curve which requires physical fundamentals to be overwhelmingly bearish in order to attract offsetting hedge fund and speculative money to balance the market and allow sell-offs to occur. The relative steepness of a backwardated curve can be partially explained by the academic arguments related to the Convenience Yield (benefit of holding commodity). In current low interest rate environment and ample WTI volumes in storage we do not believe it explains the majority of the steepness existing in the front few years.
Part of the steepness of the curve likely derives from the widespread belief that continued growth of crude supply in North America will have a tendency to drive cash prices in the future towards the marginal cost of production. This is especially true for WTI which market participants believe could become "stranded" by growth in excess of refinery capability to handle light crudes and the lack of regulatory relief for exporting crude oil. This is further bolstered by experience with the current cash basis price of Permian, Eagle Ford, Bakken, Western Canadian Select, etc. that are trading $5 to $20 USD lower than WTI reflecting transport constraints and quality deducts. The market may be recognizing the reality of multiple pipelines that are slated to come online over the next 15 months to alleviate some of these constraints. Brent, as the global benchmark crude, does not have those pressures, but does have a supporting mechanism for the budget requirements of major producing countries like Saudi Arabia, Iran, Iraq, etc. Bank of America had estimated that Saudi Arabia's breakeven is $85+ while some countries like Russia and Nigeria need prices higher than Brent is currently trading. Natixis Commodities has forecasted the budget composite average of the exporting countries to exceed $105 per barrel for 2014.
The refinery maintenance cycle presents the most probable scenario for downward price pressure on the front of the crude curve since it represents real reductions in demand for crude during the outage. Summer is a period of high utilization so the autumn of 2014 is the period we and other analysts are pointing towards for prices to decline. The key physical item to monitor is whether PADD 3 inventories fill up sufficiently to cause a reversal in the recent destocking of Cushing terminal with a commensurate increase in PADD 3. If and when Cushing starts to refill prompt month WTI pricing will begin to feel pressure to decline. Total US crude production growth climbing towards 9 million barrels per day will be another factor the market will include in its pricing determination. At a minimum we expect the WTI crude curve to flatten and the Brent-WTI spread to widen somewhat during this time period.
ARM recommends a dynamic approach to putting on initial hedges and subsequent actions to either open up price upside or de-risk any position that has an option position embedded in it. We never recommend removing the underlying hedge which exists to protect enterprise value and the company's balance sheet. One example might involve ARM recommending entering a swap position for the first half of 2015, but not as a full strip, rather as the individual months to mitigate the impact of the backwardation curve sweeping through that time period where some months might settle above and others below a six month strip. As the price fluctuates in the months approaching the actual position period, we might recommend turning the swap into a 3-Way producer collar which would open up some price appreciation that could accrue to the bottom line. If the market provides other opportunities to add additional accretive our recommendations would provide that value to the bottom line of clients.
We also look at the risk of lower price levels as the curve shifts to a flatter shape since today's economics suggest the curve will flatten by the nearby prices declining more than the longer dated portion of the curve, which could even rise as part of a curve shift based upon past experience. The low volatility environment we are experiencing dictates significant patience on the part of producers who need to hedge further out on the curve. Preparing management and boards with information on potential market outcomes is important so quick action can be taken when the market shows value in the curve or in options structures further out the price curve since they can be very fleeting as the market recognizes the opportunity and acts to arbitrage it away.
About the Author
Keith Barnett joined Asset Risk Management in April 2012 as a senior vice president and the Head of Fundamentals. In this capacity he provides optimization strategies for clients who hedge energy commodity positions in crude oil, NGLs, natural gas and power. Prior to joining ARM, Barnett served as Director of Strategic Analysis for Merrill Lynch Commodities. He also worked most recently with Spring Rock Production, which is producing a state-of-the-art natural gas and oil production forecast for the US and Canada. Barnett has more than 30 years of experience in the energy industry. He served as the Natural Gas Task Force lead for the Edison Electric Institute. He has testified as an expert before the Federal Energy Regulatory Commission and the US Senate Committee on Energy and Natural Resources about natural gas and power matters. He attended Texas A&M University where he received his bachelor's degree in engineering.


