Unconventional play upside potential
Photo courtesy of Apache Corporation.
The most promising growth may lie in the Permian
Per Magnus Nysveen, Rystad Energy
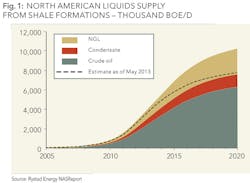
Oil and NGL production from unconventional tight plays in US and Canada as of June 2014 has reached a rate of 5.5 million barrels per day and will pass six million barrels during the last quarter of the year. The year-on-year net addition from these plays has been as high as 1.4 million barrels per day over the last 12 months and we estimate the same potential for the coming year, primarily driven by inflow of new rigs and fleets to the Permian, where the horizontal oil rig count over the last six months has grown from about 200 to 300 rigs, and where learning curves for intensity and efficiency are trending positively. This observed growth rate is in line with our predictions published in Oil & Gas Financial Journal in May 2013. Our long term 2020 estimate is now at 10 million barrels per day, or two million barrels higher than our estimate one year ago. On top of this tight oil supply comes about 11 million barrels per day from other North American sources, including conventional fields (~6 MMbbld in 2020), oil sands (~3 MMbbld), biofuel plus refinery gains (~2 MMbbld). For comparison, the current oil demand in US and Canada is also about 21 MMbbld and trending downwards (See Fig 1).
The revision of our long-term shale oil outlook is driven by:
- faster growth of activity across the Permian plays (exposed companies are PXD, DVN, APA)
- down-spacing, longer laterals, and more efficient pad operations on maturing plays (EOG, CLR, HES),
- initial production flow rates have also improved more than foreseen due to various technology enhancements including increased amount of proppant (EOG in Bakken), reduced cluster spacing (COP in EFS) and some optimization of cluster location by microseismic interpretation (SLB).
- increased capacity outlook for ethane extraction in the Northeast wet gas plays (AR, RRC) and NGLs transport to the Gulf Coast (MWE, EPD).
We have also looked at the further upside potential by considering a maximum growth rate for rig count equal to 200 new horizontal oil rigs per year, and also considering constraints from infrastructure capacity including expansion projects in each play. Based on such analysis we would estimate the "upside risk" is 12 million barrels of total liquids from North American tight plays by 2020, or two million barrels higher than our latest baseline scenario. Interestingly, we see that cash flow from operations could balance the D&C spending growth even in this bull scenario, indicating that financing is not necessarily a bottleneck for operators going forward: base production is growing, wellhead breakeven prices are improving, and spreads are getting more robust.
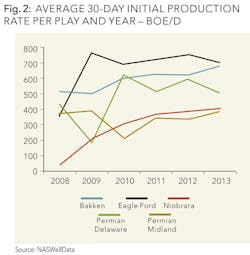
So how many well locations are still to be drilled in the sweet spots and when will we reach the "inflection point" for learning curves on each play and acreage? By studying our comprehensive data on well completions and production, combined with our detailed maps on geology iso-lines and prospectivity, we may conclude that such inflection point has already been reached by some operators in the core of the Bakken and could be reached by most operators in the core of the Eagle Ford play within 1-2 years (See Fig 2.)
The unexpected increase of US oil supply has contributed to keeping Brent crude oil prices balanced around 110 USD/bbl over the last three years to the benefit of the global economy. Brent spot monthly volatility from 2007-2010 was exactly twice the volatility observed from 2011-2014, and this despite increased geopolitical turmoil during the last three-year period. Global petroleum liquids demand is set to increase by an average of 1 MMbbl/d per year up to 2020, and we believe US oil supply additions will more than balance the global demand growth for the next 2-3 years, from then additional sources of growth would be needed. We see this long-term supply growth primarily driven by the huge inventory of proven deepwater oil discoveries amounting to 75 billion barrels of recoverable oil with very competitive breakeven prices.
The US net import of seaborne crude and petroleum products could turn to net export within three years. This seaborne net import is already approaching two million barrels per day, with three million barrels per day imported by pipe and rail from Canada, and net export of as much as two million barrels of refined petroleum products.
Spending trends
After a temporary slow-down of the activity growth rate on US shale plays in early 2013, curves are now back to higher trends of 10% CAGR for D&C spending, again very much in-line with our estimates a year ago. This growth rate is now confirmed by operator guiding and budgets where we see pure-play shale companies are guiding fairly flat due to cash shortages, whereas more diversified E&Ps are relocating CAPEX from international to US shale giving a net effect of 10% spending growth on US shale.
Spending on drilling, completion, and lease equipment in North American shale plays will thus reach 140 billion USD in 2014 and possibly continue to grow at the same rate in 2015, also driven by the increased activity in the gas plays. Only the Bakken seems to have reached a spending plateau; the sweet spots are drilled-up and infrastructure investments are leveling out. The same should go for Eagle Ford in 2015, whereas the Permian is still in its infancy in terms of unconventional development.
Bakken
Bakken oil production has passed 1 MMbbld when including about 50 kbbld produced in Montana. In our May 2013 article we estimated production from new wells was 90 kbbld per month where 70 kbbld balances base decline, thus 20 kbbld net addition per month. Actual net addition has averaged 19 kbbld over the last 12 months, closely in line with our predictions, despite the interruption of operations on completions and connections during the winter storms. The backlog of wells awaiting completion/connection has increased by about 300 wells during the last winter. Drilling permits have also increased by about 15% over the last 12 months, and leasing activity is also robust. We forecast strong growth for Q3 before a likely slowing down in Q4, giving a yearend exit rate of about 1.1 MMbbld (ND only, excluding conventional wells).
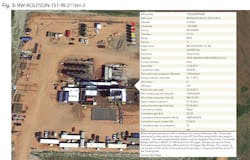
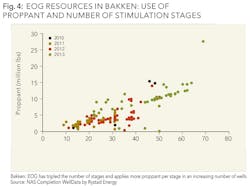
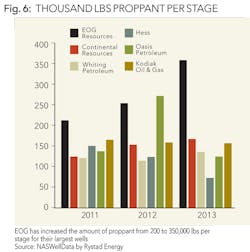
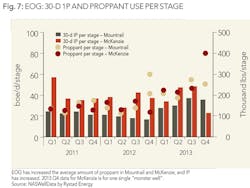
Figures 4 and 7 show a significant trend for completions in the Bakken: Over the last two years, EOG has doubled the number of stages per well and also increased the average amount of sand per stage from 150,000 to 250,000 lbs. These monster completions mostly happen in the Parshall area (Mountrail), but for one single well—completed in December 2013 in the Antelope area of east McKenzie with 69 stages and a 14,000 ft lateral length—EOG applied 12 thousand metric tons of sand, or about 120 rail cars. This well tested 24h-IP at 1,830 bbl/d oil and 30d-IP at 1,200 bbld/d. It is not obvious that marginal returns are positive for the last stages of such monster wells. However, the results appear staggering: EOG is now the operator with the highest average initial production rates in the Bakken, and other operators are now following.
Another significant trend is pad drilling with efficiency gains analogous to assembly lines in car factories: During 2013, 80% of all new wells in the Bakken were drilled on a multi-well pad.
Permian
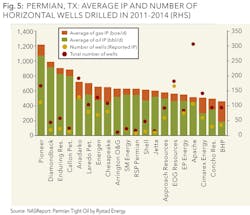
The wedge production from unconventional wells in the Permian basin has now reached 1.1 MMboe/d including 700 thousand barrels of light oil and 200 thousand barrels of NGL. Permian Midland contributes almost 60% and Permian Delaware almost 40% to the overall Permian tight oil supply, while the remainder is from the Northwest Shelf basin (NM) and Central Platform plays. In the first half of 2014, horizontal rig count in the Permian has increased 50% year-on-year in the Delaware basin to 160 rigs (as of early June), and in the shallower and more oil-weighted Midland basin, the count has doubled year-on-year towards 140 horizontal rigs. Operators' budgets indicate this steep growth rate on rig counts should slow down towards the end of the year. On average, wellhead breakeven prices appear marginally better in the Permian than in the Bakken and the Eagle Ford, primarily due to lower well cost as the deeper wells are at about 7,500 ft in the Permian Wolfcamp vs. 8,500 ft and 12,000 ft, respectively in the Bakken and the Eagle Ford.
We believe Permian Midland's various tight oil plays could have recoverable reserves comparable to that of the Eagle Ford, which we now estimate at 20 billion barrels of oil, while Permian Delaware is rivaling the Bakken in terms of production potential and oil reserves at 15 billion barrels. This assumes still positive de-risking of the multi-stack potential within the thick Bone Spring group in the Delaware, the Spraberry layers in the Midland, and the Wolfcamp horizons across both sub-basins.
Oil supply from the Permian basin, including conventional legacy production, is now approaching 1.5 MMbbld, the same production rate as we saw in the 1950s. The basin peaked in 1973 at 1.8 MMbbld, an event that brought fame to Hubbert's theory of peak oil and enormous wealth to desert sheiks. Production from the Permian is set reach an all-time-high within two years, and still the basin will add another million barrels of oil per day before its second peak a decade from now. Thus, peak oil blogs will continue losing readers and Middle East budgets will continue the struggle to balance. That is, at least for a couple of years while new Permian sweet spots are found, thus extending the period of calm before the next inevitable storm in the global oil markets.
ABOUT THE AUTHOR
Per Magnus Nysveen joined Rystad Energy in 2004 and is leading the analysis team. He has particular expertise as an upstream portfolio and transaction advisor as well as wide experience with financial and fiscal regimes globally. He is also responsible for valuation analysis of unconventional activities and is in charge of the North American Shale Analysis. Nysveen has developed comprehensive models for production profile estimations and financial modeling for oil and gas fields. He has 20 years of experience within risk management and financial analysis, primarily from DNV. In addition, he was responsible for risk assessment of the European Space Program, residing eight years in France and three years in South America. At DNV, Per Magnus had a pivotal role in various projects assessing offshore project risks and petroleum portfolios. He holds an M.Sc. degree from the Norwegian University of Science and Technology and an MBA from INSEAD in France.


