Part 2: Operational and profitability assessment - Financial economics of the Arman oil field in Kazakhstan
EDITOR’S NOTE: This article provides an operational and economic assessment of a small onshore oil field in Kazakhstan. The Arman field in western Kazakhstan is estimated to hold recoverable reserves of 3.65 million metric tons of oil and 74 million cubic meters of gas. The field began production in 1994 as a joint venture between Oryx Energy, MangistauMunaiGas, and Zharkyn (the state holding company), and currently is operated by Royal Dutch Shell in a 50:50 joint venture with Lukoil. In part 2 of this 2-part article, the authors offer an operational and profitability assessment of the field.
The Arman field in western Kazakhstan began production in 1994 and is currently operated by Royal Dutch Shell in a 50:50 joint venture with Lukoil. In the conclusion of this 2-part article, we describe the contract structure of field development, operational activities, and capital expenditures. We conclude by assessing investment profitability.
CONTRACT STRUCTURE
E&P contract types
In order to convert mineral assets into financial resources, a government must attract investment capital to explore for, develop, and produce its natural resources. Many styles of contracts govern the arrangements between the host government (HG) and the international oil company (IOC) engaged in exploration and production activity. These arrangements have evolved over many decades in response to political, economic, technical, and geologic conditions.
Today, there are essentially 4 basic types of E&P contracts: concessionary (royalty/tax), contractual (production sharing contracts), participation agreements, and service agreements (Gallun et al., 2001). Each arrangement provides for different levels of control to the IOC, for different compensation arrangements, and for different levels of national oil company (NOC) involvement. The type of contract an HG will enter into with an oil company varies across country, time, and region and, as one would expect, the strictest fiscal regimes tend to be in countries that offer the most attractive geological prospects, combined with political and macroeconomic stability.
Royalty/tax systems allow the title to hydrocarbons to transfer to the IOC; while under a contractual system the HG retains title to the mineral resources and maintains closer control of the management of the operation. Participation agreements create a joint venture between the HG and IOC through the NOC as partner; while in a service agreement, a company agrees to perform a service for a monetary payment. Service agreements rarely include a right to share in production and, outside the Middle East, are not popular for E&P activity.
Royalty/tax and production sharing contracts are by far the most common agreements in use today. Industrialized countries have tended to rely more on royalty/tax systems, while PSCs are the primary choice for many developing countries, especially those opening up new areas for exploration or revising their petroleum legislation.
Laws governing petroleum operations
In Kazakhstan, 4 laws govern the economic terms established in a subsurface contract: the Subsurface Use Law (Law No. 2828, 1996), the Petroleum Law (Law No. 2350, 1995), the Tax Code (Code of the Republic of Kazakhstan, 2002), and the Production Sharing Agreement Law (Law No. 2-III, 2004).
Arman contract
The Arman field is governed by a royalty/tax JV under a 30-year license. For a royalty/tax system, the contract holder secures exploration rights for a specified duration, and development and production rights for each commercial discovery, subject to the payment of royalty and taxes and other conditions.
For the Arman contract, all costs related to the main operations are fully deductible, with capital expenditures depreciated using a 3-year straightline method. A 10% loan uplift for the first 4 years of operation was also negotiated. Royalty was set at 3% of the value of production for the first 6 years, increasing to 4% thereafter. Corporate income tax and withholding tax on net income are fixed by law at 30% and 15%, respectively. Loss carry forwards are allowed up to 7 years.
OPERATIONAL ASSESSMENT
Combined results
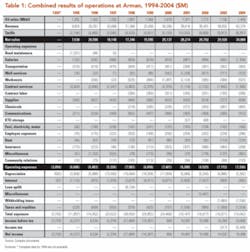
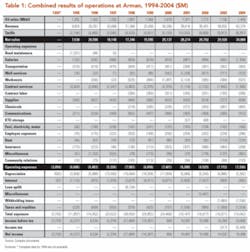
The combined results of operations at Arman from 1994-2004 are summarized in Table 1.
Sales
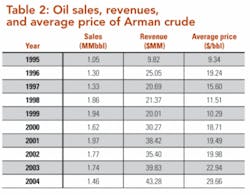
Oil sales, revenue, and average price per barrel are depicted in Table 2. The average price of Arman crude is correlated closely with Brent with price differentials due primarily to quality considerations (Bacon and Tordo, 2005). The drop in world oil price in 1998-1999 lead to a significant reduction in project revenue, but high prices in recent years have since yielded strong sales revenue despite a decline in production.
Tariffs
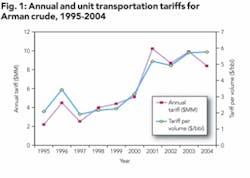
Transportation tariffs to deliver Arman oil to market are shown in Figure 1 on a gross and per barrel basis. In 2004, the average tariff on CPC was $5.75/bbl. This tariff was paid across three segments of the pipeline: KazTransOil ($2.53/bbl), CPC-Kazakhstan ($0.75/bbl), and CPC-Russia ($2.72/bbl), according to negotiated terms.
Operating expenditures
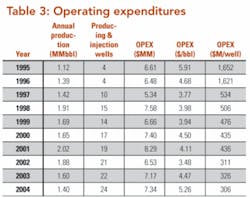
Operating expenditures on a per barrel and per well basis are shown in Table 3. Operating cost is related to production throughput, fuel usage, and maintenance requirements. Unit operating cost and production exhibit a weak inverse relationship. At high production levels the operating cost per barrel is small due to the fixed nature of the cost. As the field matures and requires additional expenditures on workovers and maintenance, additional variable costs are incurred. Average well operating cost has declined over time.
Fixed Costs
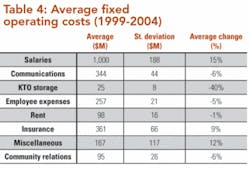
Fixed costs are independent of energy output and are quoted on an annual basis. Salaries and employee expenses, rent, insurance, and community relations are computed as an average because they do not have readily identifiable system drivers. Average fixed operating costs over the 5-year period 1999-2004 are shown in Table 4. Field operations are mostly performed by contract labor and under service agreements. Several cost categories have decreased over time.
Variable Costs
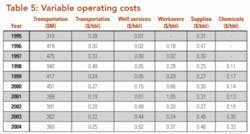
Variable operating costs include transportation, well services, workovers, labor, chemicals, and supplies. Transportation costs are determined by throughput on an aggregate and per-barrel basis. Average transportation costs are roughly $0.23 per barrel (Table 5).
At the start of operations, well services were negligible but have increased quickly over time, and the trend in these costs appears to follow field production. Workover costs are driven neither by production nor by the number of wells, since workovers typically occur on an as-needed basis prior to the onset of a regular maintenance program. Supply expenses are correlated with the number of producing wells. As the number of wells increases, supplies have also increased. Chemical costs are only partially explained by the number of active wells.
Depreciation
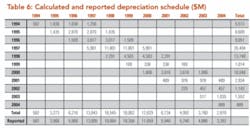
The company depreciates capital expenditures over a three-year straightline using the nearest month convention. In Table 6, we compute depreciation using a half-year convention and compare with the reported values. The match is reasonably close with differences believed to be due to the schedule convention and reporting requirements.
Interest
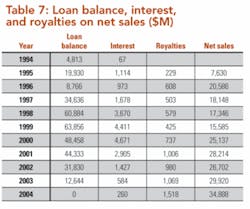
The loan balance and interest at the end of each year is shown in Table 7. Oryx provided the initial equity financing at an interest rate set at 3-month LIBOR plus 2%. During the first 4 years of production, a 10% loan uplift increased allowable deductions; a cumulative loan uplift of $8.13 million was deducted in 1998 at the end of the 4-year period. In 2004, the loan was repaid.
Royalties
Royalties are payments made to the government for the right to produce petroleum. Royalties are typically either set at a specific level (based on the volume of oil and gas extracted) or in terms of ad valorem taxes (based on the value of oil and gas extracted). The royalty rate at Arman is applied to the value of hydrocarbons sold, netted back for the cost of transportation. The royalties paid on net sales is depicted in Table 7.
Withholding taxes
Foreign entities that operate through a permanent establishment pay a 30% corporate income tax on taxable income and a 15% withholding tax on net income, calculated as the difference between taxable income and corporate income tax (Ernst and Young, 2006). Withholding tax was computed to be 13% in 2003 ($1.86 million withholding tax on $14.3 million net income) and 10% in 2004 ($1.536 million withholding tax on $15.5 million net income). The computed and specified rates differ because differences exist in how taxable income is calculated, since some costs not related to the generation of revenues; e.g., social contributions and administrative costs, are not deductible.
Income taxes
Taxable income is calculated as the difference between aggregate annual income and statutory deductions, with tax losses carried forward up to 7 years. The company incurred losses from 1994-1999, and only started to pay income tax from 2003 (Table 8).
CAPITAL EXPENDITURES
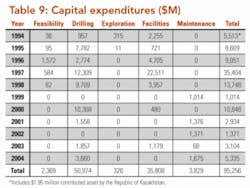
Capital outlays are shown in Table 9. Drilling and completion costs comprise more than half of the total expenditures, with average drilling and completion costs around $2 million per well. Cumulative capital expenditures for drilling through 2004 were $51 million, and nearly 90% of the total was incurred by 2000.
Facilities costs are the second major cost category. The majority of facility cost was incurred during the first 4 years of production. Maintenance and other costs (including site abandonment and restoration) will be incurred near the end of the productive life of the field. According to public announcements, the company does not plan to drill new wells, but will focus on increasing production from existing wells and on expanding the processing capacity of equipment to handle North Buzachi oil.
FIELD PROFITABILITY
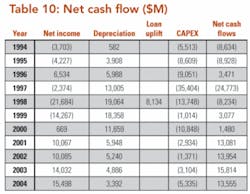
The net cash flows of operation are shown in Table 10. The net present value (NPV) at a 10% discount rate is -$9.3 million. The internal rate of return is 4.4%. The NPV is expected to become positive in the near future because of a planned reduction in capital expenditures and sustained high oil prices.
References
1. Bacon, R and S. Tordo, “Crude oil price differentials and differences in oil qualities: a statistical analysis,” ESMAP Technical Paper 081, Washington D.C., October 2005
2. Bagirov, E., B. Bagirov, I. Lerche, and S. Mamedova, “South Caspian oil fields: onshore and offshore reservoir properties,” Natural Resources Research, Volume 8, No 4, 1999, 299-313.
3. BP Statistical Review of World Energy 2006 (www.bp.com/statisticalreview2006). Brealey, R.A. and S.C. Myers, Principles of Corporate Finance, 4th Edition, McGraw-Hill, New York, NY, 1991.
4. Caldwell, R.H. and D.I. Heather, “Characterizing uncertainty in oil and gas evaluations,” SPE 68592, SPE Hydrocarbon Economics and Evaluation Symposium, Dallas, TX, 2-3 April 2001.
5. Code of the Republic of Kazakhstan “Concerning taxes and other obligatory payments to the budget” of 12 June 2001 effective from 1 January 2002.
6. Ernst and Young, 2005 Oil and Gas Tax Guide, Almaty, Kazakhstan, March 2005.
7. Gallun, R.A., C.J. Wright, L.M. Nichols, and J.W. Stevenson, Fundamentals of Oil & Gas Accounting, 4th Edition, PennWell Books, Tulsa, OK, 2001.
8. International Monetary Fund, 2004, Republic of Kazakhstan - Selected Issues and Statistical Appendix, IMF Country Report No. 04/321 (Washington International Monetary Fund).
9. Law No. 2-III “On certain amendments and changes into the legislative acts of the Republic of Kazakhstan concerning subsoil use and oil operations in the Republic of Kazakhstan” of 1 December 2004 effective from 8 December 2004.
10. Law No. 2350 of the Republic of Kazakhstan having the force of Law “Concerning petroleum” 28 June 1995.
11. Law No. 2828 of the Republic of Kazakhstan “Concerning the subsurface and subsurface use” of 27 January 1996.
12. Stulberg, A.N. “Moving beyond the great game: the geo-economics of Russia’s influence in the Caspian energy bonanza,” Geo-Politics, 10:1-25, 2005
13. Ulmishek, G.F., “Petroleum geology and resources of the North Caspian Basin, Kazakhstan and Russia,” U.S. Geological Survey Bulletin 2201-B, U.S. Department of the Interior, U.S. Geological Survey.
14. Available at http://geology.cr.usgs.gov/pub/bulletins/2201-b
15. Votsalevsky, E.S. et al.: Oil and Deposits of Kazakhstan Reference Book (3rd edition), Committee for Geology and for Subsurface Protection of the Ministry of Natural Resources and Protection of the Environment of the Republic of Kazakhstan, Almaty, 1999.
16. Zettlitzer, M. “Successful field application of chemical flow improvers in pipeline transportation of highly paraffinic crude oil in Kazakhstan,” SPE 65168, Presented at the SPE European Petroleum Conference, Paris, France, October 24-25, 2000.
About the authors
Mark J. Kaiser [[email protected]] is a research professor at the Center for Energy Studies at Louisiana State University in Baton Rouge, La. His primary research interests are related to policy issues, modeling, and econometric studies in the oil and gas industry. Prior to joining LSU in 2001, he held appointments at Auburn University, the American University of Armenia, and Wichita State University. Dr. Kaiser holds a PhD from Purdue University.
Anar Kubekpayeva is with the Kazakhstan Institute of Management, Economic, and Strategic Research, Bang College of Business, Almaty, Kazakhstan.
