SPECIAL REPORT: Economics of Reservoir Management - Modern seismic analysis reduces the cost of reservoir management
The job of reservoir management typically begins after a discovery well is drilled. However, it is now possible to begin proper reservoir management even before the first well is drilled. Advances in seismic imaging and inversion now make it feasible to see a much more distinct picture of the reservoir and to plan its exploitation from the outset.
3D seismic data has been a boon to the oil and gas industry for the last 20 or more years. In most circumstances, the mapping structure has been greatly aided by the evolution of imaging techniques, especially pre-stack time and pre-stack depth migration. The mapping of smaller, subtler structures is much easier using this data. Sometimes that is a good thing, sometimes it is not.
Through the years, many of those smaller structures have been drilled that either had no reservoir or a very limited one. The larger structures provide more opportunity for a bigger reservoir, but we all know that structure alone does not make a good well.
Therefore, simply being able to better map structure has not made us as successful as we would like. Also, many reservoirs are somewhat unrelated to structure and are rather stratigraphic in nature. This would include reservoirs such as channel sands, deltaic deposits, and other traps that are formed by changes in rock type rather than by faulting or folding.
While older production was primarily from structural traps (because they are easier to detect), most new exploration and development is coming from stratigraphic traps. These traps are often extremely subtle and difficult to map from either subsurface geology or remote sensing tools, such as gravity, magnetics, or seismic.
Fortunately, some forms of pre-stack migration produce amplitude-preserved CMP gathers (unstacked seismic data) on which much more robust analysis can be performed. As a matter of fact, there are a number of different things that one can do in the pre-stack domain. Deciding which one to perform is usually first determined from the capabilities that are available and then from geologic and geophysical factors. Available well control also is considered because some procedures depend heavily on building models from existing wells as a starting point to the analysis.
Pre-stack inversion to rock properties is a technology that has moved to the forefront in the last several years. Seismic is a tool that responds to the acoustic properties of rocks (and fluids), so the logical result of a full pre-stack seismic inversion would be those acoustic properties: P-wave velocity, S-wave velocity, and bulk density.
While those properties measured downhole have a resolution of less than one foot, modern seismic inversion generally has resolution of about 20 feet. Thinner beds are often detected but are rarely fully resolved. Twenty feet is a significant improvement over the 100-foot resolution that was possible only a few years ago at the same depth.
One of the keys to inversion’s higher resolution is the development of algorithms that extend the useable bandwidth of the seismic data itself. Only a decade ago, 25Hz was the highest frequency available at a given depth. Today, we often can extend the useable frequencies to 100 Hz (an improvement of 2 octaves), yielding a 5-time resolution improvement.
The key to us such an algorithm is its ability to properly restore frequency response that is the true result of the geology and to maintain relative amplitude while doing so. If both of these goals can be accomplished, there is a much better chance that one can invert the seismic data to reflect reliable rock and fluid properties.
Case history
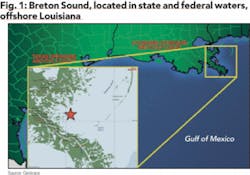
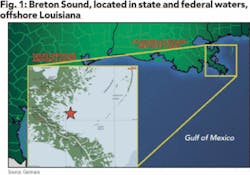
An inversion scheme was applied to the Breton Sound 3D* data set in state and federal waters offshore Louisiana (Fig. 1). Fortunately, the inversion method employed in this case does not require a high density of existing wells because there was only one well (it was dry) in the 9-block area and it penetrated only to about 17,500 feet.
This well was essential to calibration, however, in the otherwise data-driven pre-stack inversion. When the inversion was accomplished, a multi-attribute analysis was performed using three of the inversion products: bulk density, Poisson’s ratio, and Young’s modulus.
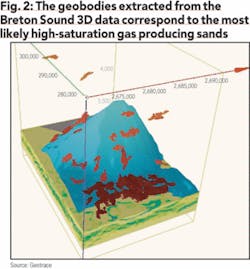
Using 3-dimensional cross plotting, potential high-quality gas-bearing sands were detected from depths ranging from about 13,000 feet to almost 22,000 feet. Those zones with a high Young’s modulus (“stiff” rocks that correspond to clean sands), low density and low Poisson’s ratio (a combination associated with high gas saturation) were delineated and classified as distinct geobodies.
Fig. 2 shows a frame from the 3D visualization on the volume. A horizon is shown in the image (blue) corresponding to the base of the analysis window and conformable to the top of salt where the dome penetrates the sediments. There are a number of geobodies ranging from 800 acre feet to 16,000 acre feet in size.
Using estimates of temperature and pressure from surrounding fields and the total acre feet in the anomalies, it is estimated that a minimum of 60 million BOE is contained in the two largest highlighted sands. Most of these would not have been detected using conventional (post-stack) seismic methods.
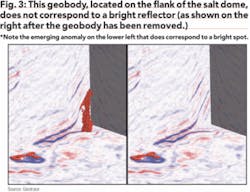
On the other hand, false anomalies corresponding to sands with low gas saturation would have been uncovered with amplitude verses offset (AVO) analysis, the pre-stack product that most explorationists rely on these days. Only by going to full inversion to rock properties can one know with a great degree of confidence that there is good reservoir and sufficient saturation before drilling.
The post-stack problem is shown in Fig. 3. On the left, one can see a geobody that has a high probability of producing commercial gas, but when that geobody is removed (right panel) there is no amplitude anomaly associated with it. Even if the interpreter is using stacked data to find potential anomalies and then doing pre-stack analysis to high-grade them, this opportunity to find new pay has already been missed.
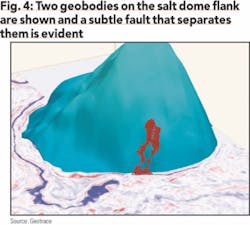
A good example of a 2-compartment reservoir is shown in Fig. 4. It is apparent that one well would not drain the area because a subtle fault divides the reservoir’s two parts. Is it worth putting down two wells to exploit this area? The information is there to help make a decision.
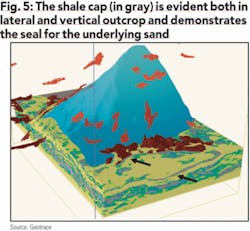
Note in Fig. 2 that the upper portion of the analysis window is sand-poor while the lower portion is a veritable sand pile - very widespread and very thick. Fig. 5 backs us up a little in the visualization process, near the top of the very deep anomaly. While most of the huge pile of sand is filled with salt water, the dark red geobody corresponds to an isolated, productive zone.
What reason would there be for just one part of such a huge pile of sand to contain gas? A seal - there is a relatively thick, tight shale (gray in outcrop) that completely covers the anomaly - something that is missing in the rest of the area at that depth.
Getting to the point
So what does all of this have to do with the economics of reservoir management? Let’s review what we know about the Breton Sound data set after inversion:
- There is only one well in the area, and it was a dry hole - good quality sands were encountered, but they contained no commercial gas accumulations.
- We have located areas that are not only good quality sands but very likely have high-saturation gas.
- Several well paths could be planned to exploit both shallow and deep pay.
- Several of the larger anomalies have variable density and Poisson’s ratio - the likely sweet spots might be targeted first or multi-well penetrations may be planned to best exploit them.
- A good estimate of reserves has been prepared and informed decisions can be made whether or not to exploit each of the geobodies.
- When a well is drilled into an anomaly and pay is found, there will be no need to drill possibly dry holes simply to find the down-dip limit. Every expensive well will be drilled for the best possible results.
We can assume that four initial wells will be drilled at a cost of about $85 million. A quick survey of the industry tells us that the work described above, including processing the seismic from field tapes all the way through pre-stack inversion to rock properties, would cost approximately $250,000 or less and can generally be accomplished in about two months.
A client described this seismic-analysis-to-well-price relationship a few months ago as “decimal dust.” Obviously, if this really works - and it does, no such drilling program should proceed without similar work on the front end.
It has been demonstrated over the last several years that this approach is not just for younger rocks. Outstanding results have been seen onshore in places as disparate as the Gulf Coast, Anadarko basin, and Green River basin in the US and the onshore Nile delta in Egypt.
Even carbonate and gas shale plays lend themselves to such an approach. Many wells have been drilled based on this type of analysis, an approach that greatly increases the likelihood of finding the best reservoirs.
There are many other tools to help properly and economically manage a reservoir: 4D analysis, injection wells, and reservoir simulation. All are widely used to great advantage. We can easily see, however, that pre-stack inversion to rock properties can benefit all three of these pursuits.
Whether one is looking for the best possible place for an injection well, parameters to plug in to simulation software, or a concrete comparison between two data sets, rock and fluid properties inverted from seismic data are an excellent source of reliable data.
About the author
Gary Perry [[email protected]] has been in the industry since 1974 and studied geology with emphasis on geophysics at the University of Texas during his early career. He is currently vice president reservoir services, Dallas, for Geotrace and has been with the company more than 20 years. He was previously with Geo-Search Corp. from 1974 to 1986 where he performed basinal velocity studies in several offshore US basins before going into seismic processing.
* The Breton Sound 3D data is owned or controlled by Seismic Exchange Inc. The data was licensed by Cs Solutions Inc. and processed by Geotrace.
