New kinetic method models VGO hydrocracking
A simple first-order kinetic model of hydrocracking reactions using pseudocomponents closes the gap between the process and a model of the separation and reaction network. The model delivers good results for predicting product distribution after the reaction process. Refinery engineering and planning tools can effectively use this model.
Modeling is used for refinery planning and optimization. Refiners need improved modeling tools due to more-stringent new fuel specifications as well as higher refinery complexities.
The hydrocracking process is usually a "black box" in refiners’ engineering and planning tools. But the importance of hydrocracking in refinery economics necessitates a model for planning and optimization improvements.
We performed pilot plant tests of hydrodesulfurization (HDS) and hydrocracking of a vacuum gas oil (VGO) to determine kinetic parameters of the reaction. From these data, we established a pseudohomogenous first-order kinetic model.
We described the feed and reaction products with a pseudocomponent distribution. The results of model predictions show good agreement with measured data.
Background
Ruhr Oel GMBH, a joint venture of Veba Oel, BP PLC, and Petroleos de Venezuela SA (PDVSA), runs a 5,000 tonne/day hydrocracker at its facilities at Gelsenkirchen. Feed is usually vacuum gas oil (VGO) with small amounts of atmospheric gas oil. The unit was originally designed for naphtha mode but is currently running in diesel mode.
Main products are kerosine, diesel, heavy and light naphtha, and LPG. The bottoms product, unconverted oil (UCO), is used as a high-value steam cracker feedstock.
Increasing demand for diesel and petrochemical feedstocks, as well as more-stringent fuel specifications, make the role of the hydrocracker much more important.1 Although important, the unit is often modeled as a "black box."
Often, only one "typical" yield structure is used for planning and optimizing the refinery targets. The planners do not consider changes in feed quality or different process conditions. We therefore formed a project between the refinery, its research facilities (ARAL Research), and a university (Technische Universität Bergakademie Freiberg) to develop a simple, yet robust hydrocracking model.
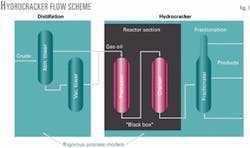
Fig. 1 shows the research work’s objective: to close the gap between the rigorous models for distillation processes using kinetic calculations for the reaction.
Pilot plant test runs with VGO determined yield structures of the hydrocracking process as a function of temperature. Reactor temperature is, in practice, the main condition for process control. We described feed and product qualities with 65 equidistant (every 10° C. average boiling point [ABP]) pseudocomponents. For each component, kinetic parameters led to a kinetic model of hydrocracking.
Finally, model results were compared with the plant data. We found an accurate, simple, first-order kinetic model to predict hydrocracker yields.
Step 1: Feed description
Reaction partners must be developed before modeling the reaction. This is the most difficult step. One cannot use "real" components because petroleum fractions contain hundreds of different hydrocarbons. One solution is to use pseudocomponents calculated from feed data available in the refinery system-usually density and a boiling curve analysis.
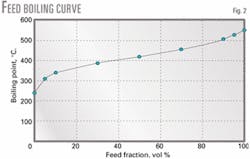
Fig. 2 shows the boiling behavior (ASTM D-1160) of the hydrocracker feedstock. The discrete boiling points are interpolated with cubic splines to get a smooth curve.
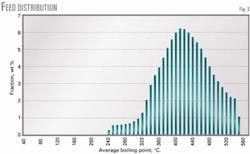
We converted the data into true boiling points (TBP). Then we integrated the curve and split it into equidistant pseudocomponents characterized by ABP, density, molecular weight, and weight fraction (Fig. 3).
These properties were calculated with common API procedures.2 We then established a reaction system for the conversion of these pseudocomponents to lighter products during hydrocracking.
Step 2: Pilot plant testing
We performed pilot plant tests to determine kinetic parameters for each pseudocomponent. We analyzed sets of reactor effluent samples (boiling behavior) according to temperature, feed quality, and space velocity. They were then, as in Step 1, split into pseudocomponents. The hydrocracking process was split into two parts, hydrotreating (removal of heteroatomic injuries) and the origin-cracking step.
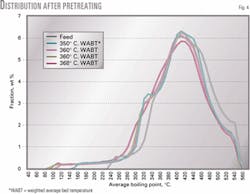
Fig. 4 shows the feed and product distribution of pseudocomponents after pretreatment for different reactor-weighted average bed temperatures (WABT). In addition to desulfurization and denitrogenation, minor cracking reactions occur during hydrotreating. Effluent from this stage is fed to the cracking step.
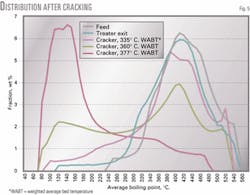
Fig. 5 shows measured pseudocomponent distributions after the cracking reactor according to WABT. Fig. 5 demonstrates the influence of temperature on product quality. For low WABTs, the feed is converted into products in the boiling range of kerosine and diesel; for high WABTs, the yield of naphtha increases.
Step 3: Determine kinetic parameters
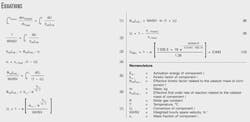
We described the hydrocracking reactor with a homogenous model for an ideal isothermal plug flow reactor to model the hydrocracking reactions. Equation 1 (see Equation box) shows the basic balance equation for a pseudocomponent of this reactor.3
Equation 1 is rewritten as Equation 2 after inclusion of the mass-related space velocity, WHSV. Equation 3 shows an effective rate of a first-order reaction and Equation 4 shows the actual weight fraction of component i. We obtain Equation 5 for component i.
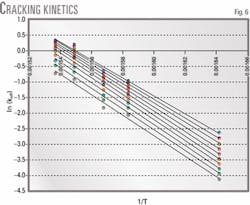
After integrating and using the Arrhenius equation (Equation 6), we can calculate the conversion of each pseudocomponent (Equation 7). Values for k∞,i and EA,i are determined by plotting ln (keff)mS vs. 1/T using Equations 8 and 9.
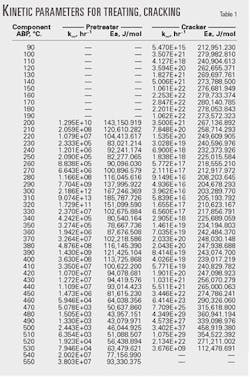
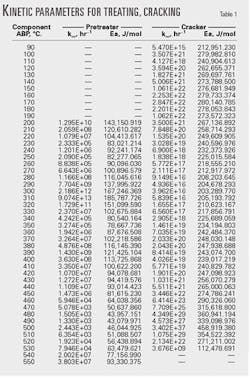
Pilot plant testing determines the weight fractions of each pseudocomponent before and after reaction. Fig. 6 shows examples of kinetic plots for hydrocracking reactions. Kinetic parameters for the reaction system were calculated from these plots. Table 1 shows the results of these calculations.
- Example calculation. Determine the hydrocracking conversion of material with a boiling point greater than 360° C. with a reactor temperature of 377° C. and a WHSV of 1.26 hr 21. From Table 1 we obtain k∞ = 7.035 E+19 hr-1 and Ea = 242,434.37 J/mol. Calculate the conversion using Equation 4 with T = 650.15 K. and WHSV = 1.26 hr-1 (Equation 10). This means that 84.3 wt % of the material with a boiling point greater than 360 °C. contained in the feed is converted to lighter products, or otherwise 15.7 wt % is still contained in the product. The measured value is 84.5 wt %; the error in this case is 0.23 wt %.
Step 4. Model evaluation
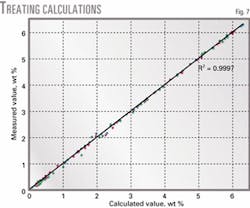
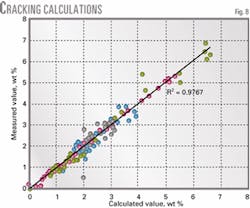
To evaluate the kinetic model, we calculated the pseudocomponent distribution using Equation 7 and the kinetic parameters from Table 1. Parity plots of predicted vs. calculated yields (Figs. 7 and 8) show good agreement. The obtained pseudocomponent distribution can be used in rigorous fractionation process models to determine real unit performance and separation effectiveness.
References
- Reinhardt, J., and Balfanz, U., "Hydrocracking - solve future fuel specifications and produce petrochemical feedstocks in an economic way," presented to the European Refining Technology Conference, Rome, Nov. 13-15, 2000.
- American Petroleum Institute, "Technical data book, petroleum refining," 5th Ed., Washington, D.C., 1988.
- Dimmig, T., "Basics of reaction technologie," Script TU Bergakademie Freiberg, 2001.
The authors
Jörg Reinhardt is a senior process engineer for Veba Verarbeitungs GMBH, Gelsenkirchen, Germany. He is responsible for the design and revamp of refining process units at the Scholven refinery. He has over 10 years’ experience in this area. Reinhardt received his engineering diploma from the Technical University Bergakademie Freiberg, Germany.
Ulrich Balfanz heads the research department and is responsible for the pilot plant facilities at ARAL Forschung GMBH, Gelsenkirchen, Germany, which is part of BP Technology. He has over 10 years’ experience with refining processes as a process and plant manager. Balfanz received his PhD from the university of Essen.
Thomas Dimmig is a professor of reaction technology at the Technical University Bergakademie Freiberg, Germany. Before joining the university, he was head of technology in a chemical company. He has over 15 years’ experience in the field of chemical reactions and kinetics. Dimmig received his PhD from the University Jena, Germany.
