California refiner identifies crude tower instability using root cause analysis
An atmospheric crude tower at Atlantic Richfield Co.'s Carson, Calif., refinery experienced a severe operating instability shortly after being revamped. During the revamp, high-capacity trays were installed in the mid-pumparound (PA), and heat exchange surface was added to the top and mid-PA circuits.
The problem was unrelated to the new trays, although they were initially suspected as the cause.
The problem's root cause was the draw pan above the new trays, which had been in the tower since the original design.
Low-cost modifications to the draw pan completely eliminated the instability, allowing full benefits from the tower revamp.
The key to the revamp's success was systematic troubleshooting, based on field tests and data interpretation, which led to a correct diagnosis of the problem's root cause.
Finding the root cause
When a tower does not achieve its design expectation, a quick solution is required. It is imperative to identify the problem's root cause to reach a correct solution-a principle that is often forgotten under pressure. Failing to identify the root cause often leads to expensive solutions that may not be successful.
Diagnosing a problem requires good field measurements and careful analysis of what the measurements mean.
Sometimes the measurements are as simple as surface temperatures, which were the main diagnostic tool used in this study. More-sophisticated tools, such as gamma scans, also provide invaluable pieces of the puzzle.
Tower history
BP America Inc. (BP), through its subsidiary, Atlantic Richfield Co. (ARCO), operates two major refineries on the US West Coast. BP's Carson refinery has a crude capacity of 260,000 b/d and processes primarily Alaska North Slope (ANS) crude. It has several crude units, along with alkylation, isomerization, hydrogen production, FCC and propylene recovery, and polymerization units.
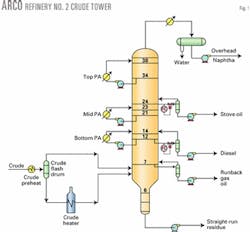
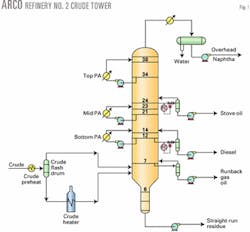
In 1995, the refinery revamped its No. 2 atmospheric crude column (Fig. 1) for clean fuels production and to process a lighter ANS crude slate. Additional overhead naphtha production was anticipated due to the lighter ANS slate.
The refinery increased heat-removal capacity in the top PA, which allowed high reflux rates in the naphtha-stove oil fractionation zone. With a fixed number of trays, this provided more fractionation and naphtha recovery as compared to previous operations, which were limited by heat removal in the top PA.
One revamp goal was to increase vapor-handling capacity for the mid-PA tower section, as well as heat duties of the top and mid-PAs.
These equipment modifications were made:
- Larger crude vs. top-PA heat exchangers were added with an additional top-PA cooler. Existing crude vs. top-PA exchangers were moved into crude vs. mid-PA service to increase surface area in the mid-PA circuit.
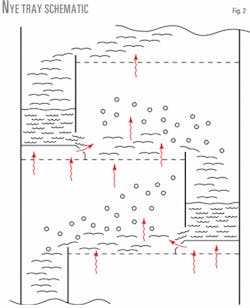
- Trays 21 and 22, in mid-PA service, were changed from conventional two-pass valve trays to two pass, Koch-Glitsch high-capacity Nye trays (Fig. 2). The Nye tray is designed to use the area under the downcomer for vapor passage and to impart a horizontal vapor velocity in the direction of tray liquid flow.1
After the 1995 start-up, the top PA could not reach its design duty, and naphtha recovery suffered. The bottleneck was tray instability, which appeared most intense near Tray 23. Since the Nye trays were the only new item in the tower, initial theories focused on their possible underperformance.
Symptoms of instability
The bottleneck became apparent immediately after the 1995 revamp. Temperature swings occurred during an attempt to increase top-PA duty. Symptoms of the instability were:
- Stove oil draw temperature to the side stripper cycled 15-25°F. peak to valley. The cycle period was 4-5 min.
- Mid-section pressure drop (between the vapor spaces above Trays 14 and 24), normally reading 1-1.2 psi, cycled 0.1-0.15 psi peak to valley. The cycle period was identical to the stove oil draw temperature. Pressure drop peaks coincided with temperature valleys.
- Mid-PA draw temperature cycled 10-20°F. peak to valley, and coincided with the stove oil draw temperature valleys.
- Smaller fluctuations during the cycling were observed in other temperatures, including the mid-PA return, top-PA draw and return, and tower overhead temperatures.
The refinery engineers observed that the instability:
- Did not occur before the 1995 turnaround.
- Only took place at high top-PA duties. When the top-PA duty was below 35 MMbtu/hr, the instability never occurred. The instability always occurred when top-PA heat duty was raised to between 38 and 40 MMbtu/hr.
- Was independent of mid-PA duty.
- Did not affect the section below the mid-PA draw.
- Had no adverse impact on product purities. The refinery could operate with the swings indefinitely and still make on-spec products.
The instability was an operational nuisance, which limited operations from raising the top-PA duty.
The tower dynamic matrix controller, initially programmed to maximize top-PA duty, was reprogrammed to limit maximum duty at 35 MMbtu/hr. Any additional heat would be removed by increasing the mid-PA duty. The limitation on raising the top-PA duty constrained the benefits from the 1995 revamp and lowered naphtha recovery.
Field troubleshooting
The refinery design team simulated the crude tower based on operating data. They noticed a discrepancy between the simulation and field data for the stove oil draw temperature. The simulation was adjusted, but the simulated draw temperature was always 15-20°F. higher than field data.
The design team attributed the cold stove oil product temperature to cold mid-PA return liquid and hot liquid from the tray above mixing in the stove oil draw sump. A simple heat balance gave the relative percentage of mid-PA mixed into the stove oil product; the simulation was modified accordingly.
With a turnaround nearing, the refinery assembled a troubleshooting team to address the tower problem. The team consisted of engineers from BP, Koch-Glitsch, and Fluor Daniel.
The team started with preliminary hydraulic calculations. These showed that, in the absence of abnormalities, all the trays normally operated at hydraulic margins 20% higher than jet or downcomer flood. So, hydraulic flooding by conventional mechanisms was considered unlikely. These results matched a previous refinery analysis.
After reviewing operating experiences and problem history with the refinery personnel, the team selected field testing to identify the root cause. The tower was tested at 100% of design crude at maximum normal operating loads.
The testing included: collecting data from the distributed control system, laboratory sampling and analysis, field temperature survey, and time studies. The team discovered the instability source through a temperature survey.
Temperature survey
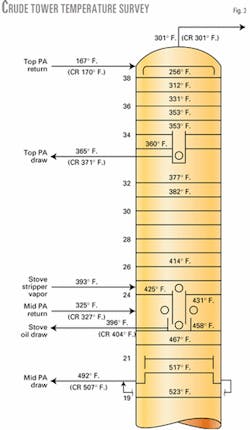
Fig. 3 shows data collected in the temperature survey. All temperatures are tower or pipe surface temperatures measured by a laser-guided infrared pyrometer. The only exceptions are those marked with the prefix "CR," which indicates temperatures measured by thermocouples and recorded in the control room.
Surface temperatures were measured wherever practical. In some locations (e.g., Trays 27-30), the insulation cover was too tight to allow a wall temperature measurement and it was not practical to cut holes in the insulation.
Fig. 3 shows good agreement between thermocouple-measured temperatures and those measured by the temperature survey.
The only discrepancy was on the mid-PA draw, where no suitable temperature measurement spot could be found.
The temperature profile in Fig. 3 looks normal, with higher temperatures lower in the tower, with one exception: the stove draw temperature is 20-30°F. colder than Tray 24 above. It is also colder (10-20°F.) than Tray 26, located three trays above. This unexpected occurrence drew attention to the stove oil draw region.
Separate measurements were taken of vapor and liquid temperatures on Tray 23, just below the stove oil draw. They looked normal and in line with temperatures on Trays 24 and 22. There was only one conceivable cause for the stove oil draw low temperature: mixing of hot liquid from Tray 24 (425°F.) with the cold mid-PA return (325°F.). This matched the conclusion from the refinery design team.
A heat balance or simple mixing calculation can determine the fraction of each liquid in the stove oil draw. Stove oil measured at about 400°F. must be 75% hot Tray 24 liquid and 25% cold mid-PA return liquid.
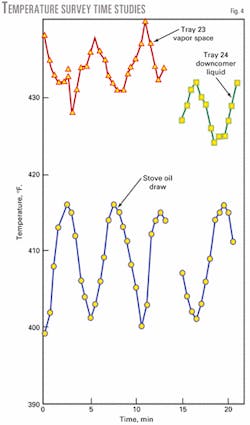
Fig. 4 shows time studies conducted using the surface pyrometer. Increasing the top-PA duty induced cycling. The stove oil draw temperature was monitored simultaneously with the vapor space temperature above Tray 23, then with the downcomer liquid temperature from Tray 24.
The time studies showed that Tray 23 vapor space temperature and Tray 24 downcomer liquid temperature cycled with the stove oil draw temperature, both peaking when the stove oil draw temperature was in a valley and vice-versa.
The time studies also showed that the difference between the stove oil draw temperature and in the downcomer liquid temperature changed from 10 to 30°F. during a cycle.
Applying the heat balance or simple mixing calculation to the hot Tray 24 downcomer liquid and cold mid-PA return liquid led to an important conclusion: During a cycle, stove oil draw varied from 10% mid-PA and 90% downcomer liquid (when the stove oil temperature approaches the downcomer liquid temperature) to 30% mid-PA and 70% downcomer liquid (when the stove oil temperature is 30°F. colder than the downcomer liquid temperature).
Swing propagation
The conclusion that temperature cycling reflected changes in the fraction of mid-PA return liquid in the stove oil draw explained the observed tower swings.
When the stove oil draw got colder, more cold mid-PA return was drawn in the stove oil and out of Tray 23. Consequently, Tray 23 warmed up. So, a stove oil draw temperature valley gave a Tray 23 temperature peak, as measured (Fig. 4).
The warmer Tray 23 generated more vapor that flowed to the tower's upper section, generating temperature peaks. This warming effect was reflected in the peaks in the Tray 24 downcomer liquid (Fig. 4), and in concurrent temperature peaks on all the upper trays.
Meanwhile, warmer Tray 23 liquid descended to Tray 21, the mid-PA draw point. With tray time constants being typically 0.1 min/tray,2 a warm Tray 23 would, within 12 sec, give a warm Tray 21 and mid-PA draw.
Once the mid-PA was withdrawn, liquid reflux to the diesel-stove oil fractionation section was small, and temperature variations did not impact the heat balance. The swings, therefore, did not affect sections below the mid-PA draw, again matching plant experience.
Pressure drop swings observed on Trays 14-24 were 0.1-0.15 psi, which translated to 4-6 in. of liquid peak to valley. When the stove oil draw became colder and the trays became warmer, more vapor flowed through Trays 21-23. This may have explained the observed pressure drop peaks (1.5-2 in. of liquid/tray). Alternatively, the warming on the trays may have initiated localized flooding, possibly on Tray 24.
Initiation of the swings
Another interesting observation was made during the tests: When the top-PA duty was below 35 MMbtu/hr, the stove oil draw temperature was steady at about 400°F. Raising the top-PA duty caused the temperature to slowly rise. A rise in stove oil temperature always indicated imminent swings. The temperature would often rise to around 425°F. Once the temperature reached 423-425°F., swings would set in. Until that value was reached, no swings would occur. During the swings, the peak temperature was typically about 415-418°F. (Fig. 4).
These observations suggested that the stove oil draw temperature coincided with the temperature of liquid from the Tray 24 downcomer when the instability began. This meant that, at the onset of swings, the stove oil draw was all downcomer liquid and contained no mid-PA liquid.
Theory testing
Although the temperature survey directed the investigators toward the stove oil draw, some preconceived theories and ideas were proposed during the tests.
In a good troubleshooting investigation, theory testing should begin with those that are easiest to prove or disprove, irrespective of how likely these theories are.3 This testing has a side benefit of providing useful information on variables to which the bottleneck responds.
The following theories were tested:
- Theory 1, a hydraulic bottleneck in the stove oil draw nozzle and rundown line. Liquid drawn from downcomers usually contains entrained gas bubbles, so the nozzle size and draw lines must be sized for self-venting flow.
A correlation,4 as well as proprietary methods, showed that the 6-in. nozzle and rundown line were too small for self-venting flow based on a stove oil draw flow rate of 320 gpm. If bubbles were present in the rundown line, the line would have "vapor locked," causing a hydraulic bottleneck.
Opening the flow control valve in the line from the tower to stove oil side stripper (Fig. 1) was the first test of this theory. Flow rate increased as the valve was opened. This argued against a hydraulic bottleneck in this line.
A more conclusive test was conducted. Stove oil draw rate was lowered to 260 gpm from 320 gpm. The diesel draw was simultaneously raised by an equivalent amount. Once these flows were established, the top-PA duty was raised while lowering the mid-PA duty by an equivalent amount.
The instability set in at the same top-PA duty with both stove oil draw rates, establishing that stove oil draw rate had no impact. This observation disproved that a hydraulic bottleneck in the stove oil draw nozzle and rundown line caused the instability.
- Theory 2, an unsealed Nye tray downcomer. On trays where the downcomer's bottom is higher than the outlet weir, there is no liquid static seal and the tray is susceptible to vapor in the downcomer at a low liquid rate.
In the crude tower, the instability always set in when liquid flow rate through Trays 21 and 22 was lowered (to shift heat duty from the mid PA to the top PA). This theory was tested with the top PA operating at its maximum stable duty (35 MMbtu/hr).
The mid-PA flow rate was gradually lowered by more than 20%, while simultaneously reducing the mid-PA return temperature (increasing temperature differential) to keep the mid-PA heat duty constant.
No instability was observed at the lower mid-PA circulation flow rates. The test established that the instability was insensitive to the mid-PA flow rate, and that the Nye trays remained stable as liquid flow rate was lowered. This observation disproved that downcomer unsealing was causing the instability.
Stove oil draw sump
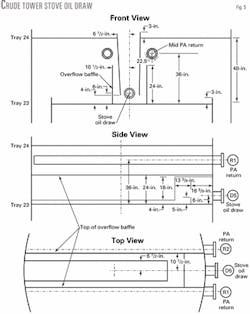
The temperature survey linked the instability to variations in mixing of Tray 24 downcomer liquid and mid-PA return liquid, which occurred in the stove oil draw sump. After alternative theories were disproved, attention focused on the draw sump (Fig. 5).
The draw sump contained many nonstandard features, which raised the question "Does the sump design initiate tower instability?" rather than "Do we like the design?"
The draw sump was at the outlet of a 44-in. center downcomer, which extended the full tower diameter for its upper 22 in. After 22 in., the first 30 in. near the tower wall on the stove oil draw nozzle side (right-hand side in Fig. 5) was closed off.
The downcomer was stepped down in length by 30 in., with a solid sidewall closing it off 30 in. away from the tower shell. The stepped-down downcomer descended, terminating 4 in. above the sump floor.
The downcomer and draw sump should operate by this mechanism (Fig. 5):
- Liquid from the center downcomer underflows the downcomer through the 4-in. clearance. Liquid then flows toward the stove oil draw nozzle, D5, where it must overflow a 5-in. weir. It is then drawn by nozzle D5.
- The draw sump and downcomer outlet are enclosed within two 24-in. overflow baffles. These baffles provide a seal to the downcomer and sump. Liquid not drawn by D5 ascends between the overflow baffles and eventually flows onto Tray 23. Before overflowing the 24-in. baffle, the ascending downcomer liquid joins the mid-PA return liquid and, together, they overflow the baffle and onto Tray 23.
- As long as liquid from Tray 24 exceeds the stove oil draw flow rate, and the downcomer and draw sump work as intended, mid-PA return liquid should not reach the draw nozzle D5. Downcomer liquid ascending between the 24-in. overflow baffle and the downcomer wall will push up any mid-PA return liquid attempting to descend between the 24-in. baffles. When the top-PA duty was 35 MMbtu/hr, the Tray 24 liquid flow rate was about 500 gpm, much higher than the stove oil draw of 320 gpm. At these flow rates, no mid-PA return liquid should have reached the draw nozzle.
At normal stable operation, however, stove oil temperature was around 400°F., which could only occur if the liquid entering the draw nozzle was 75% Tray 24 downcomer liquid and 25% mid-PA return liquid. The fact that some of the mid-PA return liquid reached the draw nozzle meant that the draw sump did not operate as intended.
How mid-PA liquid reached the nozzle
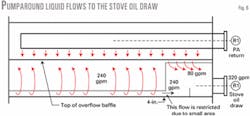
Liquid underflowing the downcomer in Fig. 5 can travel sideways toward D5 or ascend toward the downcomer overflow. There is an 18-in. liquid head, which favors liquid flow toward the draw nozzle. On the other hand, a small flow area, diverting liquid up toward the downcomer overflow, impedes liquid flow towards the draw nozzle.
The open flow path toward the draw nozzle is a 4 by 24-in. rectangle between the downcomer wall and 24-in. overhead baffle on each side of the downcomer, plus the 13 by 4-in. open area beneath the downcomer, giving 1.69 sq ft. Flow area available for rising liquid on each side of the downcomer is 4 in. between the downcomer wall and overflow baffle times the entire downcomer length (minus 30 in. closed off). This area is 8 sq ft, which is five times larger.
Downcomer liquid preferentially ascends and overflows the downcomer due to the restricted path to the draw nozzle. Its place is taken by mid-PA return liquid that enters the sump in the 30 in. between the downcomer end wall and tower wall (Fig. 6), and descends towards D5.
Flows shown in Fig. 6 are based on the conclusion that 75% of the stove oil draw liquid normally came from the downcomer. It appeared that, due to higher liquid head, 50% of the downcomer liquid managed to pass through the restricted area towards D5, but the rest chose the easier path up.
Root cause of the swings
Over a wide range of operating conditions, increasing top-PA duties had no effect on stove oil temperature, which remained around 400°F. (25°F. subcooled). As top-PA duty was raised above 35 MMbtu/hr, a point was reached where a small rise in top-PA duty (as small as 1 MMbtu/hr) caused the stove oil draw temperature to rise 25°F. and lose subcooling. The swings initiated once subcooling was lost.
The draw sump subcools Tray 24 downcomer liquid by directly contacting it with the mid-PA return liquid. Subcoolers gradually lose subcool in response to sensible heat changes.
A sudden loss of subcooling indicates that latent heat enters the subcooler, which means that vapor breaks into the stove oil draw sump at a critical top-PA duty. The only conceivable source of vapor is entrainment in the liquid from Tray 24.
Lockett and Gharani showed that, at low liquid downcomer velocities, no vapor is entrained in the downcomer underflow.5 Vapor entrainment in the downcomer initiates at a critical low velocity (0.1-0.2 fps with an air-water system). At relatively low pressures, like the crude tower operating pressure, vapor entrainment is not detrimental to tray capacity and efficiency,6 and remains unnoticed in normal operations.
Little data are available to quantify critical liquid velocity or to determine whether vapor entrainment is a function of downcomer velocity or downcomer residence time.
The only conclusion was that residence time and liquid velocity could have initiated vapor entrainment in the Tray 24 downcomer.
Vapor breakthrough into the draw sump changed the force balance that led to the flow pattern shown in Fig. 6. Liquid underflowing the downcomer was aerated. The aeration created a low-gravity, bubbly liquid between the downcomer wall and the 24-in. overflow baffle.
Lower gravity reduces the head of clear liquid between the top of the overflow baffles and stove oil draw. This increases downcomer liquid overflowing the overflow baffles, making less hot liquid available at the stove oil draw. Hot Tray 24 liquid in the stove oil draw was replaced by mid-PA return liquid, which cooled the stove oil. This is why the first step in a swing was always a drop in stove oil draw temperature.
Once stove oil temperature dropped, the liquid head in the 30-in. wide portion of the draw sump (right hand side of Fig. 6) returned to the normal 18 in. This backed some liquid up the downcomer, lowering its liquid velocity to less than the critical velocity. The vapor breakthrough stopped and everything returned to normal.
Meanwhile, additional liquid accumulated in the downcomer, which increased the velocity again beyond the critical velocity. Vapor entrainment returned and the process repeated itself. The only way to break the cycle was to reduce the amount of liquid entering the downcomer. This was achieved by increasing heat removal in the mid-PA.
Solution
All the conclusions were based on plant measurement, applying engineering principles (energy balances), and the process of elimination. Neither theory nor postulates were involved. We established these conclusions:
- The stove oil draw was 25°F. subcooled.
- The subcool was due to cold mid-PA return making up 25% of the stove oil draw.
- The draw sump did not operate as intended because some mid-PA return liquid reached the stove oil draw.
- The stove oil draw sump restricted downcomer liquid flow towards the stove oil draw nozzle.
- Due to the restriction, only half of the downcomer liquid reached the draw nozzle, the rest overflowed to Tray 23.
- The instability began when stove oil subcool was lost.
- Losing subcool reflected vapor breakthrough from the Tray 24 downcomer into the stove oil draw sump.
- The swings reflected changes in the fraction of mid-PA liquid in the stove oil draw.
The only theory used was to explain how the vapor breakthrough affected the relative proportions of downcomer liquid and mid-PA return liquid in the stove oil draw. Our theory may not be correct; other explanations may be possible.
Root cause identification, however, is dependent on our conclusions and practically independent of theory.
The root cause was the draw sump. There were three issues with the sump design: flow restriction toward the draw nozzle, sensitivity to downcomer vapor breakthrough, and the path for mid-PA return to mix the stove oil.
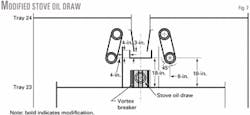
With the root cause of instability identified, the solution was straightforward. The stove oil draw sump had to be decoupled from downcomer vapor breakthrough, the flow restriction had to be removed, and mid-PA return had to be diverted out of the draw sump.
All these solutions were achieved (Fig. 7) by shortening the downcomer, terminating it in an elevated seal pan, and lowering the mid-PA return pipes so they discharged outside the stove oil draw sump.
The draw sump was modified in a March 2000 turnaround. No instability was observed afterwards. The top-PA duty has increased to 42 MMbtu/hr from 35 MMbtu/hr with no operating problems. Duty is limited to 42 MMbtu/hr by the amount of surface area in the top-PA heat exchangers and not tower instability.
The stove oil subcooling completely disappeared. Stove oil temperatures are consistently 430-440°F., depending on the desired draw rate and product end point. The higher PA duty gave the desired improvement in naphtha recovery. With the swing-generating bottleneck gone, the objectives of the 1995 revamp were achieved in 2000.
Acknowledgment
The authors would like to thank Mark Johnston, ARCO, whose tower experience and testing paved the way to identifying the problem, and to Walt Stupin, Fluor Daniel, who identified some of the most critical missing links. Many of their contributions are among the pages of this article.
References
- Kister, H.Z., Brown, E., Yanagi, T., and Sorensen, K., "Testing a depentanizer containing Nye trays," AIChE Annual Meeting, Los Angeles, November 1997.
- Shinskey, F.G., Distillation control for productivity and energy conservation, McGraw-Hill, New York, 1984.
- Kister, H.Z., Distillation operation, McGraw-Hill, New York, 1990.
- Sewell, A., "Practical aspects of distillation column design," Chemical Engineering, No. 299/300, 1975, p. 442.
- Lockett, M.J., and Gharani, A.A.W., "Downcomer hydraulics at high liquid flowrates," I. Chem. E. Symp., Series 56, London, 1979, p. 2.3/43.
- Zuiderweg, F.J., "Sieve trays; a view on the state of the art," Chem. Eng. Sci., Vol. 37, No. 10, 1982, p. 1441.
The authors
Henry Z. Kister is director of fractionation technology at Fluor Daniel, Aliso Viejo, Calif. He has over 25 years' experience in design, trouble shooting, revamping, field consulting, control, and start-up of fractionation processes and equipment. Previously, he worked for Brown & Root, ICI Austral ia, and Fractionation Research Inc. Kister is the author of "Distillation Design" and "Distillation Operation," and has authored 60 articles. He holds a BE and ME from the University of NSW, Australia. He is a Fellow of IChemE and a member of AIChE.
Daryl W. Hanson is a chemical engineer with Process Consulting Services, Houston. His responsibilities include process and equipment design and field troubleshooting. He specializes in all phases of refinery distillation from process simulation through field inspection. Previous experience includes lead process specialist for Koch-Glitsch Inc., Dallas, where he was involved with more than 100 column revamps including heavy oils and light-ends recovery. Mr. Hanson has authored more than 20 technical papers on revamping, troubleshooting, and distillation. He holds a BS in chemical engineering from Texas A&M.
Tom Morrison is a coker process engineer for BP at its Carson, Calif., refinery. Previously, he spent seven years as a process design engineer/ supervisor for debottleneck projects on the crude, coker, FCC, and diesel hydrotreating units. Before that, he spent three years as operations supervisor at Carson's cogeneration unit. Mr. Morrison holds a BSc in chemical engineering from California Polytechnic University, Pomona, and an MSc in chemical engineering from University of California, Davis. He is a registered professional engineer in California.
