OPEC Discipline, Inventory Cuts Key to Oil Prices in Second Half
Oil and gas industry investment and activity levels in the second half of 1999 depend on whether members of the Organization of Petroleum Exporting Countries keep production close to quotas adopted in March.
OPEC discipline so far has made room for withdrawals from the excess inventories that accumulated during late 1997 and 1998, when demand growth slowed while crude production climbed. With inventories approaching capacity, demand for new production fell, and prices plummeted. The market stayed out of balance into the first quarter of 1999.
Demand growth remained sluggish as Asian developing countries and some countries in Latin America struggled with financial problems that slowed economic growth. The only way to balance the market was to cut production levels.
At the start of the second quarter OPEC proved that it still possessed some market power. It lowered production quotas effective Apr. 1 for all members except Iraq. Member countries slashed output enough to make room in the market for needed withdrawals from inventories.
World crude prices jumped to a level 60% above that of yearend 1998. The average world export crude price averaged only $9.57/bbl in December 1998 and was up to an average $15.27/bbl for May this year.
Inventories, despite withdrawals in the first half, remain excessive and will continue to represent a major source of supply in the second half, when demand is expected to grow. This will keep pressure on OPEC to sustain the production discipline it achieved in the second quarter.
Uncontrolled production by OPEC would weaken crude prices and chill industry investment and activity.
Signs of recovery have appeared for Asia and Latin America-the areas previously considered to be petroleum`s growth market. The International Monetary Fund projects economic growth in the Asian developing countries will step up to 5.9% in 1999 from 4.4% in 1998. The area had been growing at a rate close to 9%/year prior to the crisis. Growth in the Latin American region is projected to improve to 4.3% in 1999 from 3.2% in 1998.
If these growth rates do not materialize, world oil demand will depend on economic growth elsewhere.
The IMF projects advanced economies will grow by an average of 2.5% in 1999 vs. 2.4% in 1998. The European Union group of countries will grow at by 2.8% this year, IMF says, the same as in 1998. Japan`s economy will grow 1.3% in 1999 after a no-growth year in 1998.
For the world as a whole the IMF projects an improvement in economic growth to 3.7% in 1999 from 3.1% in 1998. The increase will boost demand for oil.
Drilling activity worldwide slumped along with crude oil prices through the first quarter this year. The international rig count (excluding the U.S. and Canada) averaged 615 for the first 4 months of 1999, compared with 810 for the same period a year earlier. In April this year the count was 598 vs. 810 in the same month of 1998.
For the first 5 months of the year, the Canadian rig count averaged 195 vs. 333 for the same period last year. In May the rig count in Canada was only 64, compared with 157 in May 1998. Some of the decline was related to weather.
The U.S. rig count averaged 535 for the first 5 months, compared with 928 for the same period a year earlier. The average for May 1999 was 516 vs. 855 in May 1999. The U.S. rig count will set a record low in 1999.
The question for the rest of 1999 is whether OPEC can hold enough production off the market to allow inventories to fall back to normal levels relative to demand. The group`s April quota and related production cuts, augmented by cuts from nonmember exporters, apparently lifted spot crude prices enough to weaken the incentive to hoard crude. Stocks have begun to fall.
Before the market can be said to have recovered from the Asian shock of mid-1997, however, inventories will have to fall more in the second half. Whether they can do so depends on OPEC. Rising demand will help.
International market
World demand for petroleum products increased modestly in the first half from the same period of 1998. Demand rose sharply in the industrialized countries of the Organization for Economic Cooperation and Development (OECD) and slightly in Asia.
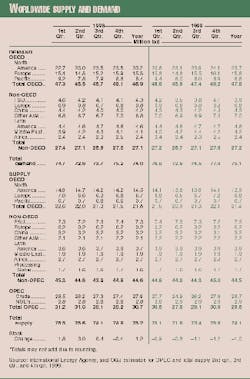
According to the International Energy Agency, total worldwide oil demand averaged 74.3 million b/d during the first half of 1999, up from 73.65 million b/d for the same period a year earlier. OECD demand, strengthened by economic growth and a near-normal Northern Hemisphere winter, averaged 47.35 million b/d for the first half, compared with 46.4 million b/d last year. Demand in Pacific OECD countries averaged 8.7 million b/d for the first half of 1999, up from 8.5 million b/d in first half 1998. North American oil demand averaged 23.35 million b/d, up from 22.85 million b/d. Demand in OECD Europe fell to 15.3 million b/d from 15.1 million b/d a year earlier.
A slump in the former Soviet Union pulled non-OECD demand down to an average 26.95 million b/d for first half 1999 from 27.25 million b/d for first half 1998.
Demand in the developing countries of Asia rose to an estimated average of 6.95 million b/d for the first half this year from 6.75 million b/d during the first half a year ago. Petroleum demand stayed at 4.3 million b/d in China, 4.5 million b/d in Latin America, 2.4 million b/d in Africa, and 850,000 b/de in East Europe. Middle East demand moved up to 4.1 million b/d from 4.05 million b/d.
In the FSU, first half 1999 oil demand averaged 3.85 million b/d, down from 4.4 million b/d in the first half of 1998.
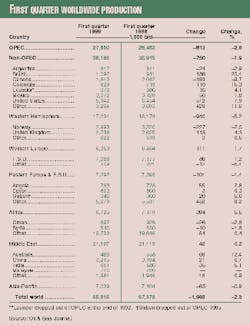
While world demand inched up in the first half, production fell to 73.5 million b/d from 76 million b/d in the same period a year earlier.
Non-OPEC supply fell to an average of 44.3 million b/d for the first half from 44.95 million b/d from the same period last year. North American output fell to an average 13.95 million b/d from 14.8 million b/d in first half 1998. Output from OECD Europe, primarily the North Sea, slipped to 6.65 million b/d from 6.8 million b/d. Total OECD production averaged 21.2 million b/d during first half 1999, down from 22.3 million b/d in the same period of 1998.
In the non-OECD developing countries average production increased to an estimated 21.45 million b/d from 20.95 million b/d in first half 1998. Increases occurred in Latin America, Asia, and the FSU.
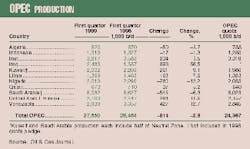
OPEC liquids production averaged an estimated 29.2 million b/d in the first half this year, down from 31.1 million b/d in the first half a year earlier. Output was made up of crude production of 26.3 million b/d and NGL and condensate output of 2.85 million b/d. Crude production in the first half of 1998 averaged 28.35 million b/d.
The OPEC quota that took effect in April is 22.976 million b/d, excluding production from Iraq.
Stocks during the first half this year fell by an average of 850,000 b/d, compared to a net addition in first half 1998 of 2.4 million b/d.
Stock additions averaged an estimated 1.2 million b/d for all of 1998 after net additions in 1997 averaging 800,000 b/d.
Stocks began to fall during the first part of 1999 in a trend expected to continue during the second half. OGJ estimates that world stocks in the second half will be reduced by an average 1 million b/d-an amount that represents supply that doesn`t come from production. That`s why production restraint by OPEC and others remains crucial.
Worldwide outlook
The expected increase in worldwide demand this year will help. IEA projects a worldwide demand increase of 1.1 million b/d this year to an average 75.1 million b/d. Demand is expected to reach 77 million b/d in the fourth quarter-up 1.8 million b/d from the fourth quarter of 1998.
IEA projects oil demand in OECD countries of 47.8 million b/d in 1999, up 900,000 b/d from the average in 1998. Demand in non-OECD countries is projected to average 27.2 million b/d in 1999, up 100,000 b/d from 1998.
Excluding the FSU, demand in the non-OPEC countries is projected to increase 500,000 b/d. FSU demand is expected to slide 400,000 b/d to average 3.9 million b/d in 1999. The IEA outlook is for an increase in demand of 200,000 b/d in the non-OECD Asian countries, with consumption averaging 7 million b/d in 1999. Earlier projections called for declining oil demand in this region.
IEA expects total non-OPEC liquids supply to average 44.5 million b/d for 1999, down 100,000 b/d from 1998. It expects OECD crude oil supply of 21.4 million b/d for 1999, down 400,000 b/d from 1998 but rising later in the year to average 22.1 million b/d in the fourth quarter.
Some of the decline in OECD production will be offset by increased output in other non-OPEC regions. Latin American output is projected to increase 200,000 b/d to average 3.9 million b/d for the year. Non-OECD Asian production is forecast to rise 100,000 b/d to 2.2 million b/d. FSU liquids output will remain at an average 7.3 million b/d.
Processing gains are expected to average 1.7 million b/d this year, up from 1.6 million b/d in 1998.
In the second half, stocks are expected to fall at an average rate of 1.15 million b/d. Non-OPEC supply will increase slightly to 44.65 million b/d. And demand for OPEC liquids will slip to an average of 29.95 million b/d. The call on OPEC oil will rebound in the fourth quarter, however, as demand exceeds its level of a year earlier. Fourth quarter liquids output by OPEC members is expected to average 30.8 million b/d.
For the year OPEC liquids output is projected to average 29.6 million b/d, down from 30.7 million b/d in 1998.
Crude oil prices
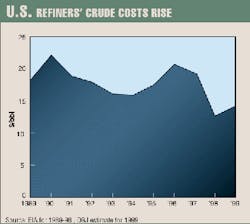
World export crude oil prices for the first half of 1999 averaged an estimated $12.95/bbl, up from $12.39/bbl for the first half of 1998 but down from the $19.09/bbl of first half 1997. The average price for June this year was an estimated $15.28/bbl vs. $11.12/bbl for June last year as OPEC`s production cuts took hold.
The world export price averaged $10.45/bbl in January and slid to $9.87/bbl in February. Strong demand in the first quarter reduced stocks and nudged the export price to $11.90/bbl for March, $14.90/bbl in April, when the OPEC cuts took effect, and $15.27/bbl in May. Stocks continued to fall in the second quarter.
The pattern was similar for both OPEC and non-OPEC export crude. The average price for OPEC export crude oil was $12.89/bbl for the first half of 1999, compared with $11.94 in first half 1998 and $18.78/bbl for the first half of 1997. The price for non-OPEC crude oil averaged $13.05/bbl during the first half this year vs. $13/bbl for the same period in 1998 and $19.48/bbl for first half 1997.
On the New York Mercantile Exchange (Nymex), the near-month futures price for light sweet crude oil averaged $12.34/bbl in January and slipped to $12.01/bbl in February before climbing to $17.75/bbl in May. For the first half of the year the Nymex price averaged $15.23/bbl, compared with $15.34/bbl for the first half a year earlier and $21.34/bbl for first half 1997.
The average posted price for West Texas Intermediate (WTI) crude oil was an estimated $14.37/bbl for the first half this year, compared with $14.58/bbl in first half 1998 and $20.47/bbl for the first half of 1997.
Data for the U.S. average wellhead price, a broader measure of all crude oil prices in the U.S., take longer than those for other price categories to compile and publish. In January and February this year, most recent months for which data are available, the U.S. wellhead price averaged $8.54/bbl. That compares with $12.82/bbl in the same 2 months of 1998 and $20.57/bbl in 1997. The low wellhead price of Alaskan crude oil tends to drag down this average.
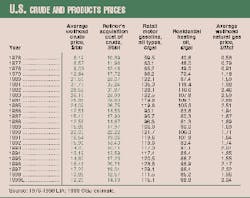
OGJ projects an average annual U.S. wellhead price of $12.20/bbl for 1999, compared with $10.88/bbl for 1998 and $17.23/bbl in 1997 and $18.46/bbl in 1996.
Product prices
Product prices reflected the low cost of crude to refiners in the first half and are likely to rebound in the second half, placing full-year averages for most products slightly above those of last year.
According to the OGJ survey of self-service unleaded motor gasoline pump prices, the average price for the first half of 1999 was an estimated $1.072/gal vs. $1.081/gal in first half 1998 and $1.236/gal in first half 1997. The average motor gasoline price, excluding all federal, state, and local taxes, fell to $0.673/gal from $0.682/gal a year earlier.
Federal, state, and local gasoline taxes averaged 39.9¢/gal for the first half of this year, the same as a year ago.
The OGJ survey showed the pump price averaging $0.974/gal in January and $0.959/gal in February, down from $1.125/gal and $1.081/gal in the same months a year earlier. As crude prices started to climb, the pump price rose to $1.014/gal in March. Higher crude oil costs and the start of the driving season pushed pump prices to an average $1.171/gal in May, compared with $1.084/gal in May last year.
OGJ expects the pump price for all types of motor gasoline, including premium grades, to average $1.151/gal for 1999, up from $1.115/gal in 1998. The motor gasoline price averaged $1.291/gal for 1997. The peak annual-average pump price for motor gasoline was $1.353/gal in 1981.
Residential heating oil prices for the first 2 months of 1999 averaged $0.801/gal vs. $0.92/gal in the same months last year. The decline was primarily due to much lower crude oil prices. OGJ expects heating oil prices will rise later in the year along with crude costs and demand to average $0.888/gal for the year vs. $0.852/gal last year and $0.984/gal in 1997.
Natural gas prices
The average price of U.S. natural gas during the first half of this year was down from the average in the same period a year earlier. But at midyear prices were well above year-ago levels. And it is expected that for the year average natural gas prices will exceed year-ago levels due to continued strong demand and closer to normal weather.
For the first half of 1999 spot natural gas prices averaged $1.875/MMBTU, down from $2.11/MMBTU during the first half of 1998. But the price in June this year was $2.15/MMBTU vs. $1.95/MMBTU in June 1998.
The Nymex futures price for natural gas averaged an estimated $2.022/MMBTU for first half 1999, compared with $2.24/MMBTU in the first half last year. But in June this year the Nymex price averaged $2.343/MMBTU vs. $2.14/MMBTU in June a year ago.
Spot natural gas prices started the year at $1.75/MMBTU in January, down from $2.19/MMBTU in January a year earlier, then climbed through the first half. Last year spot gas prices weakened late in the year due to a weather-related slump in demand. Spot prices fell as low as $1.58/MMBTU in September 1998 and averaged $1.99/MMBTU for the fourth quarter.
Spot gas prices will remain higher than year-ago levels during the second half of this year due to continued strong demand and supply limited by a slump in exploration activity.
The futures market price started weak in the first quarter but strengthened in the second quarter. The Nymex price averaged $1.796/MMBTU in the first quarter then jumped to an estimated $2.25/MMBTU in the second quarter. Last year futures prices averaged $2.21/MMBTU in the first quarter and $2.28/MMBTU in the second quarter. But the futures price then slipped to an average $2.08/MMBTU during the second half of the year.
The average U.S. wellhead price for natural gas averaged $1.80/Mcf in January this year, the only data available. This was down from $1.99/Mcf in January last year and $3.42/Mcf in January 1997.
Natural gas average annual wellhead prices peaked in 1984 at $2.66/Mcf then fell to $1.67/Mcf in 1987. The average annual wellhead price was relatively constant during 1987-91, ranging between a high of $1.71/Mcf and a low of $1.64/Mcf. The price rose to $1.74/Mcf in 1992 and $2.04/Mcf in 1993. It fell to $1.85/Mcf in 1994 and $1.55/Mcf in 1995 before strong demand pulled it back up to $2.17/Mcf in 1996 and $2.32/Mcf in 1997.
In 1997 electric utilities turned to natural gas to fill a void left when nuclear power output dropped. Last year gas demand dropped due to warmer-than-normal weather, and the average annual wellhead price dipped to $1.96/Mcf. Demand remained strong in the electric utility sector but slumped in the residential, commercial, and industrial sectors.
Natural gas demand for the first 4 months of this year, the latest data available, is up 3.1% from the same period of 1998. Demand is expected to remain above year-ago levels due to strong economic growth and closer-to-normal weather.
It is expected that prices will move up modestly as demand increases in the third and fourth quarters. OGJ is projecting an average U.S. wellhead price of $2.04/Mcf for 1999 vs. $1.96/Mcf in 1998.
U.S. economy
OGJ expects U.S. economic growth to slow slightly in 1999 in response to the Federal Reserve Board`s late-June move to raise interest rates slightly as a precaution against inflation.
The U.S. economy has been growing slowly but steadily since the latest recession in late 1990 and early 1991. OGJ expects that the 1999 gross domestic product (GDP) will be up 3.3% from the 1998 level. GDP increased 3.9% in both 1998 and 1997.
These growth rates are based upon the government`s new method of calculating real GDP, which produces growth rates slightly lower than under the older method. The new chain-weighted system does a better job of adjusting for large price swings, such as the sharp drop in the cost of computing power, and therefore a better job of measuring the true growth in goods and services.
The current economic expansion is in its 8th year. U.S. GDP in 1998 was up 24.2% from the level in 1991, an average growth rate of 3.1%/year.
This year industrial production is expected to increase an estimated 2.3% following an increase of 3.7% in 1998. New car and truck sales are expected to be 15.7 million units in 1999, compared with 16 million last year. Housing starts are projected to slip slightly to 1.57 million units from 1.62 million in 1998.
U.S. energy demand
Energy consumption in the U.S. will increase in 1999 at a rate slightly below that of the economic expansion.
Total U.S. energy consumption is projected to move up 1.7% following a decline of 0.2% in 1998. Energy consumption will move up to 91.97 quadrillion BTU (quads) for 1999 from 90.402 quads in 1998. Low energy prices will help boost consumption.
Energy consumption declined in the early 1980s but started increasing as the economy grew. There have been two long stretches of continuous economic growth and increasing energy demand. One period was 1982-90, when the economy grew at an average rate of 3.6%/year and energy consumption grew at an average rate of 1.7%/year.
There was a short recession in 1990 and 1991 that resulted in energy consumption declining 0.1% in 1990 and 0.2% in 1991. That was followed by the second period of continuous economic growth, 1991 through the present. In that period, energy consumption has risen at an average rate of 1.6%/year, while economic growth has averaged 3.1%/year.
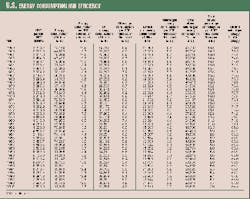
There have been steady improvements in energy consumption efficiency since 1970. Energy consumption per unit of GDP was 39% lower in 1998 than in 1970. Energy consumption per unit of GDP fell from 19,800 BTU in 1970 to 12,000 BTU in 1999. OGJ is projecting energy consumption per unit of GDP to decline to 11,800 BTU/$ of GDP in 1999.
The rate of growth in energy consumption tracks closer to GDP growth during periods of rapid economic expansion, low energy costs, or both.
Energy sources
Oil energy demand is projected to move up 1.9% in 1999 to 37.25 quads on the strength of economic growth, low product prices, and closer to normal weather. Energy from oil increased 0.5% in 1998.
Oil`s share of total energy demand will be 40.5%, the same as last year. The oil share was 40.1% in 1997. Over the past decade oil`s share of the energy market has decreased. In 1978, the year of peak oil consumption, the market share was 48.6%.
Demand for energy from natural gas is forecast to increase 2.3% in 1999 to 22.37 quads. This compares to a decline of 3% last year. Competition from other fuels and warmer than normal winter weather slowed the growth rate the last couple of years.
The natural gas market share will move up to 24.3% in 1999 from 24.2% in 1998. This compares with 24.9% in 1997. Together, oil and natural gas will provide 64.8% of the energy consumed in 1999, up from 64.7% last year.
Increased electric power consumption will boost demand for coal energy, which will be up 1.2% in 1999 to 21.42 quads. This follows an increase of 0.7% in 1998. Coal`s market share will slip to 23.3% in 1999 from 23.4% in 1998. It was 23.2% in 1997.
Energy from hydroelectric and other energy sources is expected to increase 3.4% in 1999 to 3.75 quads. This follows a decline of 9.2% last year. The market share will increase to 4.1% from 4% in 1998. The share was 4.4% in 1997. Other energy sources such as geothermal, wind, wood, and solar provided only 0.2% of total energy consumed in the U.S. in 1998.
Nuclear energy output is expected to increase 0.3% this year to 7.18 quads. This follows an increase of 7.2% last year from a year in which major maintenance projects reduced output at several nuclear facilities. Nuclear power`s market share is expected to slip to 7.8% in 1999 from 7.9% in 1998. The share was 7.4% in 1997.
Any increase in nuclear energy output is dependent upon an increase in the capacity utilization rate. The rate hit a record high of 78.2% last year. The previous record utilization rate was 77.4% in 1995. Maintenance activity lowered the utilization rate to 76.2% in 1996 and 71.1% in 1997.
There are no plans to add new nuclear units, and total capacity is starting to decline as units are taken out of service. Nuclear energy output may increase slightly this year as the capacity utilization rate increases, but it is expected to decline in the near future.
This slowing of growth in nuclear power generation will force the electric power industry to turn to other fuel sources in the future, probably coal and natural gas.
Natural gas market
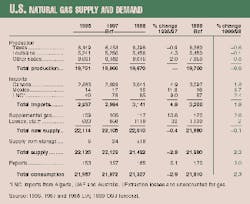
U.S. consumption of natural gas is projected to increase 2.3% in 1999 to 21.81 tcf. This follows a 2.9% decline in 1998 to 21.327 tcf related to mild weather, which reduced residential, commercial, and industrial consumption. Economic growth and more-normal weather will boost gas demand this year.
In the U.S., consumption of natural gas has rebounded from the recent low of 16.221 tcf in 1986. The record high for natural gas consumption was 22.101 tcf in 1972.
Natural gas consumption in 1998 was up 5.106 tcf from the level in 1986. The industrial sector has accounted for much of the increase. Industrial consumption increased from 5.579 tcf in 1986 to 8.87 tcf in 1996 before slipping to 8.843 tcf in 1997 and 8.561 tcf in 1998. Industrial sector consumption includes nonutility, gas-fired power generation.
Demand also moved up in other major economic sectors during 1986-98. Commercial demand increased 31.7% in the period to 3.053 tcf in 1998, although the 1998 figure was down 5.2% from the preceding year due to mild weather.
Residential demand in 1998 was up 3.9% from the 1986 level at 4.482 tcf. But milder than normal weather has actually reduced residential demand by 14.5% from the recent high of 5.241 tcf in 1996. Residential demand slipped 10.1% in 1998.
Demand for natural gas as a pipeline fuel and a lease and plant fuel totaled 1.974 tcf in 1998, up 40.2% from the level in 1986.
Utility demand has been volatile. In this sector natural gas has intense competition from other fuels. Utility demand fell from 3.197 tcf in 1995 to 2.732 tcf in 1996 then rebounded to 2.968 tcf in 1997 and 3.258 tcf in 1998. Utility demand for natural gas in 1998 was 25% higher than in 1986.
A sharp increase in electric power generation was the major reason for the surge in utility demand for natural gas in 1998. In addition, power from hydroelectric plants fell sharply, boosting natural gas demand by utilities.
In 1999 natural gas demand in the utility sector will level off and possibly decline as power output increases from nuclear and hydroelectric plants. And in this sector natural gas will face stiff price competition from coal and fuel oil.
According to the Energy Information Administration (EIA), the cost of coal for steam electric utilities dropped from $1.455/MMBTU in 1990 to $1.252/MMBTU in 1998. In contrast, the cost of natural gas for these utilities has been volatile. The gas price was $2.321/MMBTU in 1990, moved up to $2.56/MMBTU in 1993, slipped to $1.984/MMBTU in 1995, then jumped to $2.641/MMBTU in 1996 and $2.76/MMBTU in 1997 before falling back to $2.381/MMBTU in 1998.
Electric utility consumption of natural gas moved up in 1997 despite the price increase and surged again in 1998 as prices slipped. Strong demand for electric power and the decline in hydroelectric output helped boost demand for natural gas last year.
Natural gas prices during the first half of this year have averaged almost 19% lower than a year earlier.
U.S. marketed production of natural gas is expected to decline 0.6% to 19.76 tcf in 1999. This follows steady output of 19.87 tcf in 1996 and 1997 and a large inventory build last year that isn`t expected to be repeated this year.
U.S. gas output hit a peak of 22.648 tcf in 1972 but slipped to a recent low of 16.859 tcf in 1986.
Imports of natural gas, mainly from Canada, moved up from 750 bcf in 1986 to 3.141 tcf last year. Imports projected to increase in 1999 to 3.2 tcf.
Imports from Canada are projected to move up 1.8% in 1999 to 3.097 tcf. Canadian imports were up 4.9% in 1998 at 3.041 tcf. This year there will also be a small supply of LNG, 87 bcf, from Algeria, the United Arab Emirates, and Australia. This compares to LNG imports of 85 bcf in 1998, 78 bcf in 1997, and 40 bcf in 1996. There will also be a modest level of imported gas from Mexico, 16 bcf in 1999, compared with 15 bcf in 1998 and 17 bcf in 1997.
From the recent low in 1986 through 1998, consumption moved up 5.106 tcf, domestic dry gas production rose 2.847 tcf, and total imports increased 2.391 tcf.
U.S. petroleum demand
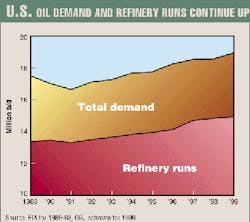
U.S. demand for petroleum products for the first half of this year-estimated at 18.77 million b/d-was up 2.1% from the same period last year.
Increases were posted for all of the major product categories. The sharpest first half increases were posted by jet fuel, 4.6%, and residual fuel oil, 2.5%. Low prices boosted demand for resid, which had been declining for years.
Demand for motor gasoline was up an estimated 1.9%, and distillate demand increased 1.8% over the first half a year earlier. First half increases in demand for the other major product groups were LPG and ethane, 2%, and all other petroleum products, 1.8%.
OGJ projects that second half 1999 demand for petroleum products will average 19.31 million b/d.
For the entire year, U.S. domestic demand for petroleum products is forecast to average a record high 19.04 million b/d, up 1.9% from the level in 1998. This will be the 8th consecutive year of increased petroleum product consumption. Product demand increased 0.3% in 1998, 1.7% in 1997, 3.3% in 1996, 0.04% in 1995, 2.8% in 1994, 1.2% in 1993, and 1.9% in 1992.
Demand peaked at 18.847 million b/d in 1978 then fell to 15.231 million b/d in 1983 due to rising oil prices.
Motor gasoline demand
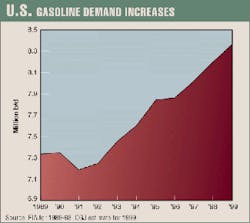
Demand for motor gasoline demand in the first half of this year was up an estimated 1.9% from a year earlier, averaging 8.14 million b/d.
A 3.2% increase in gasoline pump prices is expected to accompany the apparent strengthening of the price of crude oil. However this will not be enough to discourage motor gasoline consumption.
For the year, U.S. motor gasoline demand is projected to average a record high 8.35 million b/d, up 1.8% from 1998.
The increase in demand in 1999 will mean that motor gasoline consumption will have increased for 8 consecutive years and will be up 16.2% from 1991. Gasoline demand has set record highs in each of the past 6 years.
Before that string, the previous motor gasoline consumption record was set in 1978 at 7.412 million b/d. A large increase in pump prices pushed demand to a low of 6.539 million b/d in 1983.
According to EIA, vehicle fuel efficiency reached an average of 21.5 mpg in 1997. Efficiency gains have slowed recently as consumers have shown preference for sport utility vehicles and light trucks. Vehicle miles per gallon climbed to 21.2 in 1991 but slipped to 20.6 in 1993 before climbing slowly in recent years. In 1973 the average was only 13.4 mpg.
Driving increased steadily from 8,813 miles/vehicle in 1980 to 11,575 miles/vehicle in 1997, also raising motor gasoline demand.
Distillate
Distillate fuel oil demand during the first half of 1999 averaged 3.54 million b/d, up an estimated 1.8%.
For the year, OGJ projects distillate demand will average 3.51 million b/d, up 1.9% from 1998 and a record high. Increases in demand are expected in all economic sectors.
Distillate consumption has been increasing since 1991`s recent low 2.921 million b/d and set record highs the past 2 years: 3.435 million b/d in 1997 and 3.444 million b/d in 1978. The previous record was 3.432 million b/d in 1978.
Residual fuel oil
Demand for residual fuel oil increased to an average 830,000 b/d in the first half, up 2.4% from the same period in 1998. For the year, demand is projected to average 820,000 b/d vs. 817,000 b/d in 1998.
Demand for resid had fallen for 9 consecutive and has been on a downward trend for 20 years. The peak for resid demand was 3.071 million b/d in 1977.
Low prices are expected to boost utility and manufacturing demand for resid in 1999, and increased U.S. imports of crude oil and petroleum products will boost tanker fuel demand throughout the year.
Industries with fuel-switching capability, primarily electric utility and heavy manufacturing, are expected to switch to resid from natural gas because of the significant fuel cost savings.
LPG, other products
Demand for LPG and ethane averaged 2.015 million b/d for the first half of this year, up 2% from the same period in 1998. For the year, demand is projected at 1.97 million b/d, up 2% from 1998 consumption. Increased chemical industry consumption associated with the growing economy has helped to boost demand.
Demand for all of the other petroleum products is expected to increase this year by 1.8% to 2.77 million b/d. During the first half of 1999 demand averaged 2.625 million b/d, up 1.8% from 1998.
Demand for all other products will be boosted by a higher level of economic activity, including increased construction activity, more driving and industrial activity, and greater spending on highways. Included in this product category are petrochemical feedstocks, special naphthas, lubricants, waxes, petroleum coke, asphalt and road oil, still gas, and other miscellaneous products.
This category now represents 14.5% of total U.S. demand.
U.S. petroleum supply
The decline rate in U.S. production of crude oil and lease condensate accelerated in 1998 as E&P activity slowed due to the slump in crude oil prices.
Crude and condensate output fell 3.2% last year to average 6.243 million b/d. This came after a short period, 1996 and 1997, when new technology and increased exploration and drilling activity had slowed the decline to a crawl. In 1997 total output fell only 14,000 b/d, and Lower 48 production was on the rise.
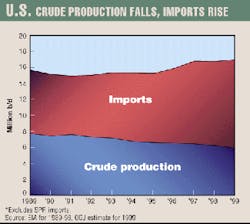
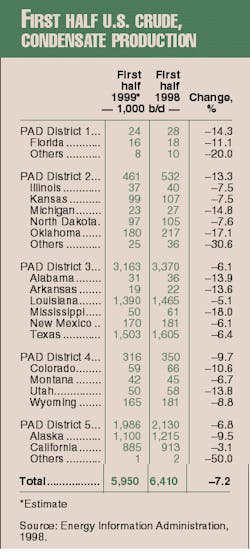
Output is projected to fall again in 1999 with an even steeper decline rate than last year. Production during first half 1999 averaged an estimated 5.95 million b/d, down 7.2% from the first half of 1998.
For the year, crude and condensate output is expected to average 5.9 million b/d, down 5.5% from 1998.
Declining Alaskan North Slope production accounts for most of the recent downward trend in total U.S. output.
During the first half of 1999, Alaskan output averaged 1.1 million b/d vs. 1.215 million b/d in the first half of 1998. Alaskan production was as high as 2.031 million b/d during first half 1988 and averaged 2.017 million b/d that year.
Lower 48 production fell 6.6% in the first half this year, averaging 4.85 million b/d. Lower 48 output of crude and condensate fell from 9.01 million b/d in 1973 to an average 5.072 million b/d in 1996 before increasing to 5.156 million b/d in 1997. Output fell along with crude prices to 5.068 million b/d in 1998.
The decline in total U.S. output is expected to continue in the second half. OGJ projects average second half output at 5.85 million b/d.
Total U.S. crude and condensate output this year will be at the lowest level since 1950-down 34.2% from the recent high of 8.971 million b/d in 1985.
U.S. crude oil production hit a peak in 1970 at 9.637 million b/d. Production then slipped to 8.132 million b/d in 1976, just prior to the addition of North Slope Alaskan output. Increases in Alaska coupled with a boom in lower 48 drilling activity led to a resurgence to 8.971 million b/d in 1985.
Production of natural gas liquids plus other hydrocarbon liquids averaged 2.13 million b/d for the first half of 1999, down 2.1% from the same period the year before. Production of NGL and other liquids is projected to average 2.08 million b/d for the year, down 1.9% from 1998. Since 1993 this production category has included oxygenate production from methyl tertiary butyl ether (MTBE) plants and fuel ethanol. Therefore, output is tied to motor gasoline demand.
U.S. total liquids production is projected to average 7.98 million b/d in 1999, compared with 8.364 million b/d in 1998. Total liquids production this year will be down 25% from the recent high of 10.636 million b/d in 1985.
Refining
Over the past few years U.S. operable refining capacity has moved up modestly but steadily in response to rising product demand. Refining capacity declined through the 1980s and into the early 1990s.
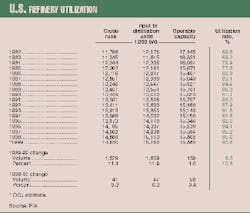
Operable refining capacity averaged 15.78 million b/d during the first half of 1999, up 0.2% from the same period the year before. Capacity is expected to continue expanding in the second half of the year as demand rises. For the year average operable refinery crude capacity is expected to rise to 15.86 million b/d from 15.806 million b/d in 1998.
During 1985-92, capacity fluctuated in a range of 15.5-15.9 million b/d; product demand was rising during this period. Refiners, under pressure to improve margins by boosting the utilization rate and lower unit production costs, cut capacity to 15.143 million b/d in 1993 and 15.15 million b/d in 1994. The refinery utilization rate climbed to 91.5% in 1993 and 92.6% in 1994.
The high utilization rates and improved margins encouraged refiners to boost capacity to 15.346 million b/d in 1995. Capacity slipped to 15.239 million b/d in 1996 and rose to 15.594 million b/d in 1997.
The average utilization rate rose to 94.1% in 1996, 95.2% in 1997, and 95.6% in 1998. That is close to full sustainable capacity because some capacity is required for maintenance downtime and contingencies.
Crude input to refineries is projected to be up 0.6% this year to average 14.93 million b/d. Total input to distillation units will move up 0.6% to 15.16 million b/d. The average refinery utilization rate is projected to remain at 95.6% in 1999. The utilization rate in the third quarter is expected to push the limits and average 98% of crude capacity.
Imports
Total U.S. imports of crude and petroleum products will set a record high for the 4th consecutive year in 1999.
In the first half total industry imports were up 3.2% at 10.52 million b/d. Both crude and product imports increased, even though stock levels were high. Refiners took advantage of low prices and boosted imports to meet the expected future increase in product demand.
Industry imports are expected to move even higher during the latter half of the year to help support increased product demand and to fill some of the gap left by sliding domestic crude production. Import requirements will be partially offset by a reduction in stocks during the second half.
Imports are projected to surge to 11.23 million b/d for the third quarter as refiners boost stocks to meet winter demand. Imports will then slip to 10.89 million b/d in the fourth quarter as stocks are reduced to cut storage costs. For the year, total imports are forecast to average 10.79 million b/d, up 3.9% from last year.
Last year imports increased 2.2% to 10.382 million b/d, surpassing the previous high of 10.1623 million b/d in 1997.
These rates far surpass levels of the late 1970s, when a surge in demand pushed imports to an average 8.786 million b/d in 1977. Imports then dipped to a recent low of 4.949 million b/d in 1985 due to increased domestic production coupled with a decline in product demand, both related to rising crude oil prices.
Dependence on petroleum imports hit a record high 55.6% of domestic demand in 1998. The import dependency level is projected to increase to 56.7% for 1999.
Crude imports are projected to increase 3.3% in 1999 to 8.83 million b/d, also a record high. Crude imports increased 4% last year. During the first half of this year crude oil imports averaged 8.57 million b/d, up 2.5%.
There have been no crude imports for the Strategic Petroleum Reserve (SPR) since June of 1994. However, the reserve increased somewhat in 1998 with the purchase of some domestic production.
Over the past few years the SPR has been tied to federal budget considerations. The size of the reserve peaked at 592 million bbl in 1994 and 1995. The SPR tapped in 1996 to raise money for operations and maintenance, pulling the inventory to 566 million bbl at yearend. There was a further reduction in January 1997 to 563 million bbl.
The SPR remained at that level until the fourth quarter of 1998, when additions from U.S. sources boosted the SPR total to 571 million bbl at yearend 1998. The SPR rose to 572 million bbl in January this year, the current level. OGJ is projecting that the SPR will be held at the current level throughout 1999.
Product imports are expected to increase by 7% to average 1.96 million b/d in 1999. Last year product imports fell 5.4% to 1.832 million b/d. Product imports averaged 1.936 million b/d in 1997.
During the first half of this year, product imports were up 6.2% from the level a year ago at 1.95 million b/d. Stock levels were high, but refiners continued to import products to meet demand during the remainder of the year, taking advantage of low costs.
Product demand strength during the second half will keep product imports relatively high, although the level will depend on how refiners manage product stocks. Product imports are projected to average 1.97 million b/d during the second half.
Over the longer run, with little excess refining capacity, increases in product demand will probably be reflected in increased product imports.
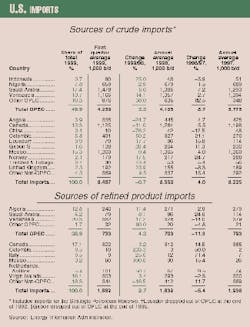
The leading source of U.S. crude imports during the first quarter of this year was Saudi Arabia, which supplied 1.478 million b/d, 17.4% of the total. Next highest was Mexico, which supplied 1.3 million b/d, 15.3% of the total. This was followed closely by crude imports from Venezuela at 1.166 million b/d and Canada at 1.125 million b/d.
Other countries supplying large volumes of crude to the U.S. during the first quarter were Nigeria 659,000 b/d and Angola 335,000 b/d.
Total crude imports from OPEC countries averaged 4.239 million b/d for the first quarter, 49.9% of total crude imports. Crude imports from OPEC averaged 4.105 million b/d during all of 1998.
Venezuela was the leading supplier of petroleum product imports for the first quarter this year at 382,000 b/d. Canada was the next largest supplier of products at 322,000 b/d. That was followed by the Virgin Island refineries, 303,000 b/d, and Algeria, 242,000 b/d. Product imports from OPEC countries averaged 733,000 b/d, 38.9% of the total first quarter product imports.
Total imports from OPEC during the first quarter averaged 4.972 million b/d, 48% of total U.S. imports in the first quarter. In 1998 OPEC provided 4.808 million b/d, 46.3% of total imports for the full year.
Stocks
Over the past few years stocks have played an increased role in U.S. supply and have also been a key indicator of pressure on oil prices. In 1997 and 1998 total industry stocks of crude oil and petroleum products moved up sharply and were a major reason for the weakness in crude oil prices.
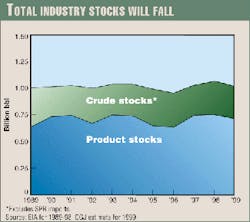
Total industry stocks finished 1998 at 1.076 billion bbl, up from 997 million bbl at yearend 1997 and 941 million bbl at yearend 1996. Total industry stocks were 971 million bbl at yearend 1995.
Crude and product stocks were reduced to close to minimum operating levels in 1995 and 1996. Refiners appeared to have adopted a stock management system with the objective of minimizing the stock level and the accompanying cost of carrying inventories of crude and products. But stocks were drawn down to levels that came close to creating delivery problems.
Minimum stock levels no longer appear to be the problem they were in earlier years. The EIA has listed 892 million bbl as the observed minimum for total industry stocks. The EIA no longer defines this as a minimum operating level, but it does represent the lowest stock level registered over the last 36 months. It was in fact the lowest industry stock level in decades
Low prices encouraged refiners to add to crude stocks in 1997 and 1998. And slowing demand growth in 1998 added to product stocks. The result was the sharp increase in industry stocks.
It is expected that stocks will fall throughout 1999. Stocks were reduced during the first part of this year and were estimated at 1.054 million bbl at end April, a reduction of 22 million bbl from yearend 1998. But in recent months industry stocks have rebounded, and preliminary EIA estimates put the early June stock level at 1.078million bbl. The stock reduction during the first half was not as dramatic as might have been expected. Low prices have encouraged refiners to purchase cheap crude to meet demand later in the year.
The high stock level will keep downward pressure on oil prices. Refiners do not want to add to the current stock level and are expected to work off some stocks to reduce inventory costs.
U.S. stocks increased by 216,000 b/d in 1998 and 153,000 b/d in 1997. In 1996 stocks fell by 63,000 b/d.
OGJ projects yearend 1999 industry stocks at 1.04 billion bbl, with the year`s drawdown averaging 207,000 b/d.
It is expected that stocks will be reduced from current levels during the second half of the year, particularly as demand increases during the heating season.
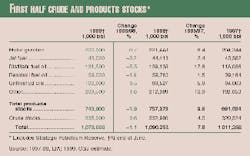
Crude oil stocks are expected to finish the year at 320 million bbl, down 0.9% from yearend 1998. Product stocks are expected to be reduced to 720 million bbl from 753 million bbl at yearend 1998. Product stocks were only 658 million bbl at yearend 1996.
OGJ estimated that crude oil stocks at the end of this year`s first half totaled 335 million bbl, up 0.6% from a year earlier, and up from 323 million at yearend 1998. Product stocks at the end of the first half are estimated at 743 million bbl, down 2% from a year earlier, and down from the 753 million bbl at yearend 1998.
At yearend 1998 total industry stocks represented 57.6 days of supply at the 1998 level of domestic demand. This was up from yearend 1997 and 1996, when total industry stocks represented 53.5 days and 51.4 days of supply. In terms of days of supply the 1996 stock level was the lowest on record. At yearend 1995 stocks represented 54.5 days of supply, and at yearend 1994 it was at 59.9 days of supply.
In the 1960s total stocks of crude oil and products represented 68-82 days of current demand. In the 1970s this dropped to a range that varied from 58 to 70 days. Government pressure boosted inventories as high as 78 days of supply in the early 1980s. But by the end of the 1980s refiners were managing stocks more efficiently and cutting inventory costs.
This year the increase in demand and constant stock level will reduce yearend 1999 stocks to 54.6 days of supply.
