Aging Canadian product line inspected internally ultrasonically
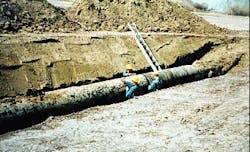
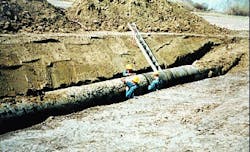
Excavation crews remove coating from pipe before performing corrosion assessment (Fig. 1).
Intensive internal inspection and repair programs undertaken in the last 2 years by Enbridge Pipelines Inc., Edmonton (formerly Interprovincial Pipe Line Inc.), have significantly improved the integrity of an aging pipeline exhibiting some unique corrosion problems.
Use of ultrasonic internal inspection technology proved reliable and effective for identifying narrow axial external corrosion (NAEC) and helped Enbridge complete a large amount of remedial work on the pipeline in a relatively short time and successfully complete a hydrotest without failure.
Enbridge system
The integrated Enbridge system (the U.S. portion of which is owned by Lakehead Pipe Line Co. L.P.) is a 14,000-km (8,700-mile) network of piping and terminals linking the producing areas of Western Canada to the refineries and markets of the U.S. Midwest and Eastern Canada.
The system transports approximately 67 different petroleum products. These include NGL; light, medium, and heavy crude oils; synthetics; condensates; and refined products and their blends. The system consists of pipelines ranging in diameters from 305 mm (12 in.) OD to 1,219 mm (48 in.) OD.
Line 3 is an 864-mm (34-in.) OD line that transports heavy crude oil to U.S. Midwest markets. The Canadian portion of the line extends from Edmonton, Alta., to Gretna, Man., and is 1,242 km (772 miles) long. The line was constructed between 1962 and 1966 and consists of API Specification 5L X-52 pipe with 7.14 mm (0.28 in.) to 12.7 mm (0.5 in.) W.T.
The coating on the line is a 0.23-mm (0.009-in.) polyethylene tape with 0.1 mm (0.004 in.) of adhesive. Cathodic protection was installed as line sections were completed and has been maintained and upgraded as required for the past 35 years.
At some locations, coating disbondment has occurred mainly as a result of soil stress. This has left areas of the pipe, typically at the longitudinal weld and at the 3 and 9 o`clock positions, exposed to groundwater.
External corrosion can occur at these disbonded sites, and cathodic protection is generally ineffective in preventing it because of the shielding effect from the disbonded tape.
Soon after construction was completed, launch and receipt traps for inspection tools were installed which divided the line into four distinct inspection sections ranging from 255 to 353 km each. These sections are Edmonton, Alta., to Kerrobert, Sask.; Kerrobert to Regina, Sask.; Regina to Cromer, Man., and Cromer to Gretna, Man.
Between 1977 and 1997, 58 in-line inspection runs were completed with intelligent tools, on different sections of Line 3. The inspection tools included geometry (for dents and ovalities), inertial (for GPS coordinates), metal loss (magnetic flux leakage and ultrasonic), and crack detection.
Inspection, excavation programs
The first corrosion in-line inspection (ILI) program on all four sections of Line 3 was conducted between 1977 and 1979 with a low-resolution magnetic flux leakage (MFL) tool.
There were 49 locations excavated between 1978 and 1982 based on the findings of the MFL tool. External corrosion was found at 15 of these locations, all under wrinkled and disbonded tape. The depth of the corrosion was between 7% and 56% nominal W.T.
In 1988, Enbridge performed another 32 excavations to determine coating performance and to assess the extent of active or accelerated corrosion. The corrosion uncovered during this excavation program indicated that another metal loss ILI was required.
In 1989, the first internal inspection using a high-resolution MFL tool was conducted in both the Kerrobert-to-Regina and Cromer-to-Gretna sections of Line 3. In 1990, the remaining sections of Line 3 from Edmonton to Kerrobert and Regina to Cromer were inspected with the same high-resolution tool.
Data from the 1989 and 1990 ILI programs yielded a priority-based listing of defects in terms of rupture pressure ratio (RPR) and maximum depth of penetration.
RPR is the ratio of predicted stress at failure to stress at 100% specified minimum yield strength (SMYS). The excavations conducted in 1990 and 1991 provided further confirmation that the polyethylene tape on Line 3 was experiencing disbonding as a result of soil stress.
Soil stress disbonding promotes the formation of wrinkles at the point of maximum stress, typically at the 3 o`clock and 9 o`clock circumferential positions on the pipe, by the pulling action of soil consolidation from freeze/thaw and wet/dry seasonal cycles. Once these wrinkles form, water is able to seep under the wrinkles and is carried along the pipelines` external steel surface by capillary action.
The source can be subsurface flowing water or water that percolates from the surface. Penetration of cathodic-protection current is limited by the high dielectric strength of the polyethylene tape and the small size of the wrinkle gaps that allow water to enter.
There were 129 excavations conducted on Line 3 after the 1989-90 internal inspection program with only 19 of these requiring sleeving. The re-inspection interval was then established at 4 years to accumulate sufficient information for data on corrosion growth.
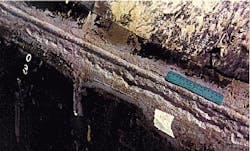
Narrow axial external corrosion (NAEC), such as shown here, caused a failure in 1995 near Glenavon, Sask., on the Regina-to-Cromer segment of Line 3 (Fig. 3).
In 1993-94, Line 3 from Edmonton to Gretna was inspected for the second time with the high-resolution MFL tool. Results from this program confirmed the predicted low growth rates of external corrosion, and only 19 sites within the entire 1,242 km (771.9 miles) of the line required excavation for assessment.
Of these 19 sites, a sleeve was applied at one location, and the remaining 18 sites were recoated with spray-applied polyurethane.
Ultrasonic inspection data
In December 1992, Enbridge ran Pipetronix UltraScan WM, an ultrasonic metal loss tool, between Cromer and Gretna. In order to determine the differences between the MFL and ultrasonic data, Enbridge contracted to have the information processed with the same engineering assessment formulas.
In 1993, five joints were excavated to assess the reliability of the ultrasonic analysis. This examination concluded that the ultrasonic tool accurately predicted the maximum depth of the defect.
In 1995, Enbridge conducted 23 excavations in the Cromer-to-Gretna section of Line 3 to provide data for calibrating the MFL tool to find narrow axial external corrosion (NAEC).
As part of the 1995 program, the 1992 ultrasonic data were also reviewed against the field excavation data. This confirmed that the earlier assessment of the ultrasonic data was correct in that all of the depths of metal loss predicted by the results of the 1992 run were predominantly within the ?10% tolerance band and confirmed that corrosion growth rates were still relatively slow.
In June of 1995, Line 3 experienced an external corrosion failure near Glenavon, Sask., in the Regina-to-Cromer section of the line. Analysis of the failure showed that it was caused by corrosion characterized as being narrow, axial, and external, a shape subsequently termed "NAEC" by Enbridge.
This was the first time this shape of corrosion was identified as a distinct and unique type of metal loss by Enbridge. In response to this failure, the company developed an investigation program to determine whether similar corrosion patterns existed elsewhere on the line and, if present, to decrease the potential for a similar rupture.
This particular defect had been previously detected by the high-resolution MFL tool but produced depth signals that were underestimated by the computer interpretation algorithms.
Enbridge`s 1995 NAEC investigation program was designed to identify all occurrences of NAEC between Edmonton and Gretna by recalibrating the high resolution MFL metal-loss sizing parameters. Metal-loss data were collected from 58 new excavation sites to provide the means to perform correlation studies between predicted and actual measurements.
From this work, the tool vendor concluded that although he was able to provide a list of the most severe NAEC locations, the sizing algorithm used to determine precise depth predictions would require additional calibration.
To complete this recalibration process, Enbridge targeted an additional 56 sites for excavation in 1996. Before this work began, the second failure involving NAEC occurred in February 1996, again, near Glenavon, Sask.
The corrosion was similar to the previous failure, although the presence of SCC in the base of 78% through-wall corrosion contributed to a lower failure pressure. This second failure prompted a change in both the excavation program scope and the data used to select sites.
The NAEC-related failures raised concerns by Canada`s National Energy Board (NEB) about the integrity of Line 3. An agreement was reached between the NEB and Enbridge to reduce pressures in the areas of known failures, run additional internal-inspection tools to find any injurious defects, and to validate the approach by a final hydrotest of one section.
The internal inspection tools used in the Line 3 Regina-to-Cromer section in 1996 were:
- GRM cleaning tool
- TD Williamson caliper tool
- Pipetronix Ultrasonic WM tool (300 hz)
- British Gas elastic wave vehicle
- British Gas TFI (Transverse Field Inspection) tool.
The British Gas elastic wave vehicle is designed to find cracks in the long seam and inside corrosion. The transverse field inspection tool, which is a new type of MFL tool, is designed to allow for better visibility of axially aligned defects.
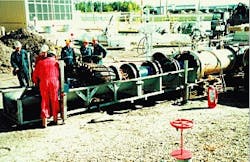
Crews prepare to launch an ultrasonic tool for corrosion inspection on Line 3 (Fig. 4).
1996 inspection program
The 1995 excavations conducted in the Cromer-to-Gretna section provided confirmation of the ability of an ultrasonic metal-loss tool accurately to measure the depth of even very narrow corrosion. Based on this demonstrated accuracy of the ultrasonic tool, Enbridge decided to use the ultrasonic wall-thickness-measurement tool in the Regina-to-Cromer section of Line 3 to identify NAEC.
The internal inspections for this section were targeted for April 1996 with launching of cleaning and caliper tools preceding the ultrasonic wall-thickness measurement tool. The length of the run between launch trap in Regina and receipt trap in Cromer is 255 km (158 miles).
The 300-hz ultrasonic wall-thickness measurement tool was calibrated for and launched in a heavy crude oil. The sensors can be calibrated for a range of crude oils with varying viscosity. And, although it is preferable to run the tool in as low a viscosity of crude as possible to minimize amplification of the signal and reduce "noise," the data collected were of very high quality.
The batches of oil in the line must remain in turbulent flow in order to avoid co-mingling and contamination of batches and therefore requires very close monitoring of pumping rates.
The ultrasonic wall-thickness measurement tool was usually launched in at least 3,000 cu m (18,700 bbl) of a selected batch and well ahead of the tail end of the batch. This was done so that if slippage of the tool occurred, there was enough oil in front of and behind the tool to prevent it coming in contact with a different batch of oil for which it was not calibrated and thereby sacrificing data quality.
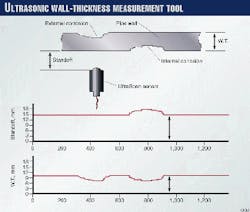
Ultrasonic measurement picks up wall loss on the pipeline exterior (Fig. 5).
Ultrasonic W.T. measurement
The aim of developing the ultrasonic wall-thickness measurement tool was to employ a non-destructive testing (NDT) method, which represented an alternative to the common MFL method. The MFL method can in principle indicate that corrosion is present and measure its extent within certain qualitative accuracy.
The MFL technique is affected by many parameters, including the defect configuration, the magnetic properties of the pipe material, and the strength of the applied magnetizing field. It is impossible quantitatively to measure the wall thickness with this method.
In contrast, the ultrasonic technique allows direct quantitative wall-thickness measurement, whereby not only the defects are indicated but also the thickness of the remaining wall and depth of defects are measured.
The ultrasound technique features the following benefits in a pipeline environment:
- Direct measurement of wall thickness and defect depth.
- High accuracy of wall thickness and defect-depth measurements value for the wall thickness. This accurate description of the cross sectional defect shape provides the best possible input for an RSTRENG calculation or similar enhanced calculation models.
- With this high level of accuracy, the ultrasonic wall-thickness measurement tool is well suited for the repeated monitoring of the pipeline and corrosion growth assessment.
- Good repeatability of data on consecutive inspection runs.
- Precise distinction between internal and external defects.
- Other features such as dents, laminations, installations, and repaired areas are clearly identified.
- One-time adjustment during initial calibration of the ultrasonic tool for all pipe-wall thickness changes.
- Easily comprehensible result interpretation; meaningful colored diagrams.
In addition to the features detectable by the MFL tools, an ultrasonic tool can also detect such other important features as laminations (sloping, bulging, surface breaking, and HIC-prelated lamination), inclusions, blisters, longitudinal channeling, and narrow axial external corrosion.
Some limitations of an ultrasonic tool are that it must be run in a liquid medium to provide a liquid coupling between the sensor and pipe wall, cleanliness of the line is critical for data quality, and consistency of the coupling medium is also important to maintain good data quality.
Ultrasound systems utilize the ultrasound echo-time technique for measuring the remaining wall thickness. The echo-time measurement is performed by perpendicular incidence according to the echo technique.
The ultrasonic pulse from the sensor is triggered by the transmitter pulse, travels across the stand-off distance (through oil, for example), is partially reflected from the inner pipeline-wall surface, and returns to the sensor as the so-called "entry echo."
The remaining sound energy penetrates the pipeline wall, is for the most part reflected from the outer pipeline-wall surface, and returns to the sensor as the so-called "rear wall echo."
The signal echo time across the standoff distance and the time difference between entry echo and rear-wall echo are stored in the pig as a multiple of a constant time base. The distance measured between sensor and pipe wall (standoff) allows a general statement regarding the location of the corrosion:
If this distance increases and the wall thickness decreases, internal metal loss is indicated. If it remains unchanged and the wall thickness decreases, the defect is located on the outer wall surface.
Tool design; data evaluation
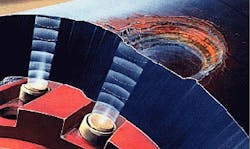
The ultrasonic wall-thickness measurement tool consists of two modules linked by universal joints.(Fig. 6) The individual modules contain ultrasonic electronics, multi-microprocessor systems for data compression, and storage and power supply.
Each module has cup sleeves at the front and rear, which act as a seal and maintain the distance between tool body and pipe wall. The sleeves also enable the tool to be transported by the medium flow through the pipeline.
The ultrasound sensors are installed on the sensor carrier at the rear end of the tool. The sensor carrier is made of polyurethane and consists of a number of skids (each fitted with 16 sensors) which are connected via joints to a guide cone.
The individual skids are interconnected by flat springs which press the skid outwards against the pipe wall. This guarantees that the sensors always maintain an equal distance to the wall.
Transverse grooves in the skids between the sensor carriers provide a flexibility that enables the skids to follow dents or uneven areas in longitudinal direction. This permits the skids always to maintain a perpendicular orientation with respect to the pipe wall.
In addition to the data from the ultrasound sensors, the position data generated by three odometers are continuously acquired and stored together with the individual ultrasound data.
The data collected during a tool run are initially classified as raw. While on-site, the inspection engineers check the data, perform a test translation, and make a backup copy to ensure data security. The data check provides detailed information on whether the run was successful.
In general the data analysis is subdivided into the following steps:
- Translation and data check
- Preprocessing of the data, which includes creating the pipe tally, marker list, and defect list. Very sophisticated software is being used to find, size, and classify the defects. This program utilizes neural networks for this task.
- Main interpretation: verification of the automatic created list.
- Maximum allowable operating pressure (MAOP; including remaining strength: RSTRENG) calculation
- Final report.
Quality checks are being performed during all the steps previously mentioned.
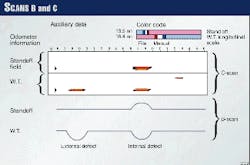
For interpretation, defects are graphically displayed on the screen. (Fig. 7) The display programs use two main tools: the color contour chart (C-Scan) and the cross section view (B-Scan).
The C-Scan represents the most efficient way of looking at a very large amount of data. It reaches into the third dimension in that it displays area and depth of corrosion in one chart.
The color display appears white for an undisturbed pipeline. And, where defects exist, colored areas appear in the chart, which very clearly mark the area extension and location of the defect.
The B-Scan is most descriptive in determining the shape and maximum depth of any specific defect. The main difference from the C-Scan is that the B-Scan displays the output from one individual sensor only.
The C-Scan is divided into two principal areas, the upper chart representing the sensor standoff and the lower chart the wall thickness. The standoff distance serves as a means to determine whether corrosion is internal or external. The same representation is also in the B-Scan where the upper trace shows the standoff values and the lower the measured wall thickness.
During the 1996 Regina-to-Cromer inspections, the vendor provided on-site analysis for the initial higher priority ranking of metal-loss features by relocating personnel and equipment to Regina. This proved very beneficial by improving reporting time and therefore response times for crews to repair any serious defects.
There were 30 excavations within 2 weeks of completion of the internal inspection runs. These were the most significant defects detected by the ultrasonic tool. A priority analyses approach was then used for the entire excavation program.
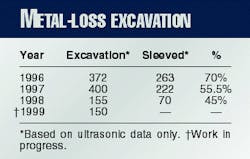
Between May and September 1996, there were 274 excavations performed to assess metal loss between Odessa and Cromer. By the end of November 1996, 372 excavations had been completed.
Investigated were all external metal loss features o50% throughwall and using the RSTRENG approach with the Rvalue that would fail if the pipe were pressure tested to 100% SMYS. The Rvalue criteria were established by comparison of actual field assessment results with ultrasonic metal loss.
Culmination of the 1996 internal inspection and repair program was the hydrostatic testing of 197.58 km (122.77 miles) of Line 3 between Odessa station and Cromer terminal.
In order to supply the large volume of water required to fill and test the 34-in. line (704,100 bbl or 111,942 cu m), it was necessary to pump water from Canal M1 in the South Saskatchewan River District No. 1. The canal crosses the pipeline at MP 320, near Cutbank, Sask.
Water was injected at a rate of 25,000 bbl/hr at 250 psi and then moved 247 km (153.5 miles) down the line into the test section. The line was then shut down to conduct the test.
The pipeline between Odessa and Cromer was divided into eight test sections using existing main line valves in conjunction with gel plugs to isolate the sections. The strength test was conducted for 4 hr and reached maximum test pressures of 860 psi at 100% SMYS. There were no leaks or failures on any of the test sections.
The test water was pigged out of the line and stored in large aboveground ponds specifically constructed for this test at the Cromer terminal. The water was aerated, retained on site for several months to allow the settlement of solids and for skimming of residual crude oil, and then chemically treated with a portable facility, and released to the watershed.
The cost of the hydrotest was approximately $12 million (Canadian) of which $4.8 million were operating expenses involved in conducting the test itself and $7.2 million were capital expenditures related to the construction of the line fill facilities and storage ponds.
1997 program
As a continuation of the work started in 1996, additional in-line inspection data were collected on Line 3 in 1997 in the Edmonton-to-Regina and Cromer-to-Gretna sections. In June, Enbridge used two of the vendor`s ultrasonic wall-thickness measurement tools simultaneously to inspect the sections between Edmonton and Kerrobert and between Kerrobert and Regina.
In the past, the tools were configured with 300-hz processors, which function optimally at a line speed of 1.0 m/sec (3.28 fps). It is possible, however, to maintain the level of required inspection detail at speeds of up to 1.8 m/sec (5.91 fps; the maximum Line 3 rate with loops out of service) with faster processors.
The vendor had only one 600-hz ultrasonic wall-thickness measurement tool available at that time. For simultaneous inspections of the Edmonton-to-Kerrobert and Kerrobert-to-Regina sections of Line 3, a 600-hz crack-detection tool had been modified to function as an ultrasonic wall-thickness measurement tool.
Utilization of the 600-hz processors will allow the tool speed to be increased to minimize the resultant impact of conducting an in-line inspection on line capacity.
In September 1997, Enbridge collected additional in-line inspection data in the Cromer-to-Gretna section of Line 3. This program consisted of complete (trap-to-trap and full circumference) inspections with the 34-in. crack-detection tool and the 600-hz ultrasonic wall-thickness measurement tool. The inspection runs were successful and another 400 excavations were scheduled for 1997 to investigate corrosion.
A team of analysts relocated to Edmonton in June 1997 to provide on-site analysis. Again, this approach was beneficial to Enbridge for expediting inspection data and completing repairs on time.
The UltraScan WM metal-loss reports for Edmonton-to-Regina were completed by the end of the year, and the Cromer-to-Gretna reports were completed by the end of February 1998. The criteria used to select sites were the same as 1996: all external metal loss o50% through wall and SMYS using the RSTRENG approach with the Rvalue that would fail if the pipe were pressure tested to 100% SMYS.
The data analysis from the crack-detection tool took until September 1998 to complete because of an enormous amount of data collected between Cromer and Gretna.
1998-99 programs
During 1998, a total of 155 excavations were performed to investigate metal-loss indications detected by the WM tools in the 1997 in-line inspections between Edmonton and Regina and between Cromer and Gretna. The site-selection criteria used was all external metal-loss features >35% throughwall and with the Rstreng approach with the R value that would fail if the pipe were pressure tested to 100% SMYS.
In addition the operator began applying corrosion-growth modeling to assist in site selection.
There have been 150 excavations planned for the 1999 Line 3 excavation program. These excavations were to be in the Regina-to-Cromer section and will investigate all external metal-loss features >35% through wall and with the same Rstreng approach as before.
When the 1999 program is completed, it will mark the end of the excavation and repair program which began in 1996 and used the ultrasonic tools to identify metal-loss sites. As of the end of 1998, there have been 1,077 excavations conducted to investigate NAEC on Line 3 that required the installation of 555 permanent sleeves (Table 2).
The Authors
Don Engen has 19 years` experience in corrosion control in oil and gas producing and transmission facilities and is currently corrosion control analyst with Enbridge Pipelines Inc., Edmonton, Alta. He holds an associate diploma (1975) in environmental science from Mount Royal College, Calgary, is an accredited NACE Corrosion Technologist (1995), and a member of Alberta Society of Engineering Technologists.
Mohammed Jaarah graduated from the University of Karlsruhe, Germany, in 1991 with an MS in electrical engineering. He began working for Pipetronix 1992 and is currently branch manager for Pipetronix Ltd., Edmonton.
