Geology plays key role in seismic attribute studies
The geologist has a key role to play in seismic attribute studies. As employed here, the term "seismic attribute study" refers to an attempt to empirically correlate (using regression, geostatistics, neural networks, or other means) one or several seismic attributes with reservoir properties derived from well information in an attempt to predict what those properties will be away from existing well control.1
The well information can include log-derived measures (e.g., net pay, average porosity) or production indicators (pressure, cumulative production, etc.). Typically, such studies are conducted on 3D data sets.
Many successful case studies have been reported. However, emphasis on the mathematical (statistical) aspects of the process has led some to suggest that there is no need to understand the physical significance of seismic attributes, or the geology, when using attributes to derive reservoir properties.2
The suggestion is that the results of mathematical analyses are enough to go on, and that a proper geological and geophysical understanding of the reservoir is not required. This approach will be referred to as the "it works-use it" philosophy in the remainder of this article, because its advocates suggest that no further testing is required once a good mathematical model has been developed.
This article has two objectives:
- To review the importance of understanding the physical basis of relationships that are used in an attribute study, and
- To suggest that it is important to ensure that the predictions made are geologically reasonable. Case studies illustrate these points.
Seismic attributes
There are many different types of seismic attribute,3 but all can be thought of as numerical measures of some characteristic of the seismic data.
Amplitude attributes (e.g., absolute amplitude, average amplitude) are the easiest to understand. They quantify how reflection amplitudes vary within the seismic data volume and intuitively can be related to properties such as porosity, lithology, fluid contact, and bed thickness. As an example, bright spots have been used successfully in the search for hydrocarbons in some settings for at least two decades now. Experience has shown, however, that they are not always reliable hydrocarbon indicators.
Complex trace attributes (e.g., instantaneous phase, instantaneous frequency) are derived from the Hilbert transform.4 Time-derived attributes include time structure and isochrons. Horizon attributes (e.g., dip, azimuth) are based on characteristics of surfaces that have been interpreted in a data volume.5 Coherency and similar attributes relate individual traces to their neighbors.6
Some attributes (e.g., instantaneous phase, instantaneous frequency, amplitude) are defined for each time sample in a 3D volume and can be displayed or analyzed as attribute volumes. Other attributes strictly refer to properties of predefined intervals within the data volume (e.g., average frequency, energy half time, maximum positive amplitude). Many other attributes than those described here can be derived, although details of their derivation and use are often obscure.
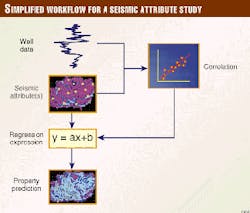
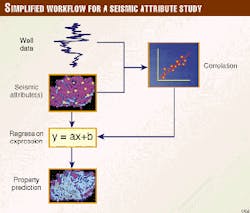
As stated previously, an attribute study seeks to establish empirical links between a number of seismic attributes and reservoir properties defined for individual wells. Once the property has been defined for all wells in a study, the values of seismic attributes at x-y locations corresponding to the well locations are extracted. The well data and seismic attributes are then correlated against each other in an effort to derive a statistically significant, empirical relationship that will predict the well property as a function of seismic attributes throughout the 3D seismic survey area (Fig. 1).
The analyst needs to assess which attribute, or combination thereof, gives the best prediction of the physical property. If a statistically significant relationship can be established between an attribute, or a set of seismic attributes, and some reservoir property, the relationship can be used to predict the value of the property away from well control in the seismic survey area. Currently, linear regression (univariate and multivariate), geostatistics (e.g., co-kriging), and neural networks are being used as means to establish the empirical relationships and then to make predictions of the reservoir property`s value for the entire area of the 3D survey. Exclusion testing, establishing the correlation using a subset of the wells then testing the prediction against wells that were left out of the correlation procedure, is commonly used to test the validity of the prediction.
Establish a physical basis
It has been suggested2 that there is a consensus in the literature that once the statistical significance and exclusion testing steps have been successfully executed, then the property predictions can be accepted without further investigation. Examination of the literature demonstrates that this suggestion is erroneous.
Schultz et al.,1 who are largely credited with popularizing the methodology, state that in order for an empirically derived equation to be derived and employed, two criteria need to be met: "first, a statistically significant relationship between the attribute and property exists, ...and second, that there is a known or suspected physical mechanism underlying that statistical connection" (italics added). It is clear that these authors did not advocate an "it works-use it" approach. Rather, they indicated that the link between the attribute(s) and the well-derived property needs to be at least qualitatively understood.
The topic of seismic attribute studies was explored at the 1996 annual meeting of the Society of Exploration Geophysicists, and this led to the publication of several important articles in the March 1997 issue of The Leading Edge. Kalkomey7 looked at the statistical basis of seismic attribute studies and concluded that "it is strongly recommended, especially when the number of wells is small, that only those seismic attributes that have a physically justifiable relationship with the reservoir property be considered as candidates for predictors (italics added). Hirsche et al.8 examined how geostatistical techniques, such as co-kriging, can be employed in seismic attribute studies. They cautioned that "(s)eismic interpretation, seismic modeling and geological interpretation techniques must be used to ensure that the statistical interpretation of the reservoir is meaningful..." Pennington9 was unflattering in his description of reservoir characterization programs that rely uniquely on statistics. He stated that "(u)nfortunately, much of the application of seismic attributes falls into the category of metaphysics, in that relationships are assumed to be valid, rather than tested and either confirmed or rejected. The solution to this problem is to incorporate the use of rock physics knowledge, locally calibrated and properly applied, to the interpretation of seismic data" (italics added).
Subsequent studies have confirmed these conclusions, no matter which type of analytical approach is used. For example, Schuelke et al.10 discussed the use of neural networks in seismic attribute studies. They state that "(n)eural networks can be very powerful analytical tools. However, they pose unique quality control problems. Often neural networks are labeled as a blackbox approach to solving a problem. This is because the system is trained to transform the input to a desired output without the need of a physical basis for the transformation... As a result, the system may find a false correlation or over fit the training data, if care is not exercised. This is sometimes referred to as "fitting the noise" or "memorization." Those authors used a rigorous validation and testing step to limit the number of attributes used in the neural network prediction to those that show a statistically significant influence and some subjectively determined physical basis for inclusion. They pointedly stated that the "blind use of statistical methods without (1) the foundation of a physical basis for the correlation between the seismic attribute(s) and the rock property and (2) a rigorous statistical analysis is very risky."
As demonstrated in the next sections, in addition to understanding the physical basis of the attributes used, a geologic analysis of the physical properties prediction map should also play an important role.
Geology, spurious correlations
If the statistics are good, and the model "works," why worry about the geology?
One of the main problems is that the relationship might be spurious, i.e., coincidental. Examples of spurious correlations might include relationships between the color of a shirt one wears and the performance of a particular stock, or the phase of the moon on spud date and well test results.
Similar spurious correlations can be found during seismic attribute studies. In addition to looking at the physical basis of the attributes used, risk can also be reduced by integrating what is known about the geology of the field.
The chances of finding a spurious correlation in an attribute study depend on the number of attributes derived and the number of wells used in the correlation.7 The greater the number of attributes derived, the greater the chances of finding a statistically significant but spurious correlation. Additionally, the fewer the number of wells, the greater the chances of finding a statistically significant spurious correlation.
While random chance can play a role, other factors can lead to problems. Acquisition and processing parameters can potentially play a role.11 Discussion at the "Pitfalls" workshop of the 1998 SEG Annual Meeting identified acquisition footprints, spatially variable surface conditions, and other factors that could potentially have an influence on seismic attribute studies. Biased sampling (wells might preferentially sample specific depositional facies) is another potential problem.8 In practice, it may not always be possible to establish why a spurious correlation exists.
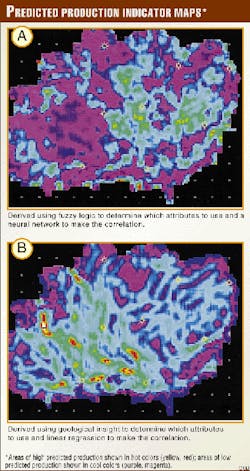
In one attribute study, a reservoir characterization team sought a correlation between seismic attributes and a production indicator from wells in a 3D survey area. A production indicator was chosen because the available log data did not permit the analysis group to use log-based physical properties for the correlation. The eight wells used in the study had been drilled and completed, with multiple pay zones, over several decades. The team extracted attributes from a window that included most, but not all of the perforated interval. The data were somewhat noisy in key areas. A fuzzy logic ranking scheme was used to determine which attributes showed the best correlation with the production indicator, and then a neural network was used to make the correlation. Fig. 2A is a map that shows the predicted production indicator.
A correlation coefficient of 0.96 was derived when the measured production indicator was plotted against the predicted value for the 8 wells. However, given the conditions listed previously, a good (let alone excellent) correlation between attributes and the production indicator was not expected. This anomalously high correlation coefficient prompted an investigation of the result.
Inspection of the map (Fig. 2A) shows that the areas of the highest and lowest predicted values are suspiciously not sampled by any wells. Analyses of the production data showed that production from this level is controlled by fractures. However, the map`s trends do not correspond to fracture trends that were mappable using dip, continuity, and other attributes.
As such the interpretation team, guided by the geology and production information, rejected the attribute-based prediction as being the result of spurious correlations despite the exceptionally high correlation coefficient. New attributes, thought to be indicators of fracture locations, were derived and examined, and a high correlation coefficient (0.89) was established with them.
The new map (Fig. 2B) could hardly look more different than the initial prediction (Fig. 2A). Without the geologic reality check, a drilling program that was based on the initial map could have been disastrous.
New insights from geology
By integrating the geology into a seismic attribute study, the results of the study can be transferred to other areas, perhaps even areas where 3D seismic data are not available (e.g., a certain combination of structural and stratigraphic features might be necessary for good production).12
Conversely, in the "it works-use it" world, every new study begins from scratch and, because the method relies on empirical correlations, there are no lessons learned that can be applied to other fields. By seeking to establish the physical basis for the selected attributes and the geologic validity of the attribute-based prediction, the role of stratigraphic, structural, or other features becomes apparent. It may be that the initial geological assumptions were incorrect and needed to be revised. Successfully leveraging this type of knowledge can have a significant bottom-line impact on a company.
An attribute study of a Permian sandstone from the Delaware basin illustrates this point. For this interval, north-south trending porosity thick zones, believed to be associated with submarine channel "fairways," correlate well with good production in some fields. A project was undertaken which attempted to extend this play concept to an area for which no production had yet been established from the target level. A 3D seismic survey and well data were available for this area. By integrating the log data with seismic attributes, it was possible to develop a statistically significant relationship that predicts the thickness of the porosity zone within the seismic survey area.
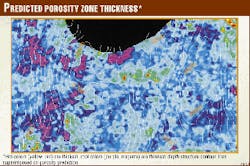
Fig. 3 shows the results. Although there are north-south trends, there are other trends as well. This result did not correspond to the initial understanding of the geology, prompting a re-evaluation of the geology and production from other fields. It was determined that fracture-related diagenesis could play an important role in controlling production from the target interval. The presence of fractures in the other areas was suggested by analysis of structure maps and production characteristics. In the 3D seismic study area, there is a correspondence between areas of good porosity development and "flexed" areas (suggested by the contours) that could indicate that fracture-related porosity could be important here.
This study demonstrates a case where the attribute study provided a different result than expected by the geologist. However, the results were geologically plausible and shed new light on the factors that control production from the target level, both in the study area and elsewhere. Exploration and exploitation strategies that integrate these results are expected to yield benefits, even where 3D seismic data are not available.
Attribute studies and risk
The main papers that have developed the methodology used in seismic attribute stress the need for the relationships between attributes and well properties to be statistically significant. Furthermore, as demonstrated above, these same papers have also established that blind reliance on the statistics is not good practice. This point is emphasized by examination of how an attribute study might be conducted for three drilling scenarios:
- A "mature" (i.e., intensely drilled) field;
- A field with moderate drilling density; and
- A sparsely drilled field.
These three scenarios approximately correspond to low, medium, and high risk situations.
It could be argued that when well data are abundant, such as in a mature field, the chances of a spurious correlation are small and good statistics are enough to go on.
The logical extension of this philosophy is that where the abundance of wells is great enough, 3D seismic technology itself is not necessary (there are certainly cases where this could be true, for example shallow blanket sands, or wherever else the cost of drilling is low compared to the cost of 3D seismic acquisition).
While this is where the "it works-use it" approach is likely to be on the surest ground, the geology should be sufficiently well established that the cost of integrating the geologic understanding should be relatively small. This exercise will provide information on how to explore for and develop analog fields elsewhere.
Usually, the fact that 3D seismic data have been collected for an area implies that drilling risk is somewhat more elevated. In this case, even though enough subsurface data might be available to establish a firm statistical basis for an attribute study, risk reduction is an important consideration and collective experience has clearly shown that integration of seismic data with other data types is crucial.13 Here, the cost of merging or reconciling the attribute-based prediction with the results of geologic and geophysical studies is likely to be small compared to the cost of a dry hole.
In the final case, the number of wells is small enough that the statistical basis for the attribute study is not well founded. In this case, a forward modeling approach, integrated with geological analyses of the prediction map,11 can be the only way of establishing that a certain combination of seismic attributes will be useful for making physical properties predictions. Risk reduction is a priority, and reconciliation of all approaches to the problem (geology, geophysics, statistics, engineering) is vital.
While these three examples are conceptually straightforward, the reality is that the boundaries between them are gray and will vary depending upon project economics and a company`s risk tolerance. Arguably the latter two cases are where a seismic attribute study is likely to have the greatest impact.
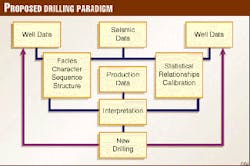
Fig. 4 shows a suggested seismic analysis workflow. On the left side, seismic data, logs, and other data are integrated in a traditional interpretation of the geology (stratigraphy, structure). On the right, seismic and well data are integrated in an attribute study to predict physical properties. The two approaches are then compared.
Where agreement is found, confidence in selecting drilling locations should be high. However, where the two methods produce conflicting results, there is a need to re-evaluate and reconcile the geologic and the mathematical analyses. New data, obtained through drilling, are fed back into the analytical process and geologic and geostatistical analyses are completed again. As outlined above, the amount of effort put into one side or the other of the methodology will be a function of the age of the field and data availability.
Conclusions
Seismic attribute studies can and should play an important role in the development of reservoir management strategies.
Previous studies have demonstrated that it is important to integrate statistically based analyses with geophysical understanding of the origin of the seismic attributes used in the correlation procedure. This article has emphasized the additional need to evaluate the physical property predictions from a geological perspective. Doing so will help to reduce risk and can add insights on how to explore for or develop similar fields elsewhere. Although the statistical significance of the relationships between seismic attributes and the well-based properties is important, statistical relationships should not be used alone to make reservoir management decisions.
Although it has not been discussed here, a lot of hard work needs to be done before a team should even consider undertaking an attribute study. This work includes carefully tying the log and seismic data and carefully picking the key stratigraphic surfaces in the seismic data volume (rather than blindly relying on autotracking algorithms). No amount of numerical manipulation can account for poor input data (garbage in = garbage out), but rather the chances of a spurious correlation are likely to increase.
The geologist choosing to become involved in attribute studies faces some obstacles. Learning about the meaning of the different seismic attributes and understanding the mathematical basis for the different types of correlation methods are among them. However, by choosing to become involved in attribute studies, the geologist can ensure that critical geologic information is not left out of the reservoir management process. This will benefit the company`s bottom line and, perhaps, the geologist`s own marketability.
References
- Schultz, P.S., Ronen, S., Hattori, M., and Corbett, C., Seismic-guided estimation of reservoir properties, SPE 28386, presented at SPE 69th Annual Technical Conference and Exhibition, 1994.
- Balch, R.S., Weiss, W.W., and Wo, S., Correlating seismic attributes to reservoir properties using multi-variate non-linear regression, in Demis, W.D., and Nelis, M.K., eds., The search continues into the 21st century, West Texas Geological Society Pub. 98-105, 1998, pp. 199-203.
- Brown, A.R., Seismic attributes and their classification, The Leading Edge, Vol. 15, 1996, p. 1,090.
- Tanner, M.T., and Sheriff, R.E., Application of amplitude frequency and other attributes to stratigraphic and hydrocarbon determination, in Payton, C.E., ed., Seismic stratigraphy-applications to hydrocarbon exploration, AAPG Memoir 26, Tulsa, 1977, pp. 301-327.
- Dalley, R.M., Gevers, E.C.A., Stampfli, G.M., Davies, D.J., Gastaldi, C.N., Ruijtenberg, P.A., and Vermeer, G.J.O., Dip and azimuth displays for 3D seismic interpretation, First Break, No. 7, 1989, pp. 86-95.
- Bahorich, M., and Farmer, S., 3-D seismic discontinuity for faults and stratigraphic features: the coherence cube, The Leading Edge, Vol. 14, 1995, pp. 1,053-58.
- Kalkomey, C.T., Potential risks when using seismic attributes as predictors of reservoir properties, The Leading Edge, Vol. 16, 1997, pp. 247-251.
- Hirsche, K., Porter-Hirsche, J., Mewhort, L., and Davis, R., The use and abuse of geostatistics, The Leading Edge, Vol. 16, 1997, pp. 253-260.
- Pennington, W.D., Seismic petrophysics: an applied science for reservoir geophysics, The Leading Edge, Vol. 16, 1997, pp. 241-244.
- Schuelke, J.S., and Quirein, J.A., Validation: a technique for selecting seismic attributes and verifying results, 67th Annual Internat. Mtg., Society of Exploration Geophysicists, Expanded Abstracts, 1998, pp. 936-939.
- Hart, B.S., and Balch, R.S., in press, Approaches to defining reservoir physical
- Pearson, R.A., and Hart, B.S., Stratigraphy and seismic-guided estimation of log properties of the Second Sand member of the Bone Spring formation, Delaware basin, New Mexico, in DeMis, W.D, and Nelis, M.K., eds., The search continues into the 21st Century, West Texas Geological Society Pub. 98-105, 1998, pp. 213-219.
- Hart, B.S., 3-D seismic: what makes interpreters tick?, The Leading Edge, Vol. 16, 1997, pp. 1,114-19.
The Author
Bruce Hart has been a petroleum geologist with the New Mexico Bureau of Mines since 1995. He previously held research positions with the Geological Survey of Canada and the Penn State Department of Geosciences. His principal research interests lie in understanding the relationships between seismic data, stratigraphy, structure, and rock-reservoir properties. He has over 60 publications on topics that range from modern sedimentary processes to seismic attribute analyses. Current responsibilities include technology transfer, and he has given workshops and short courses on 3D seismic interpretation at regional and national meetings. He has a BA (Hons.) degree from McMaster University, an MSc degree from the Universite du Quebec a Rimouski, and a PhD from the University of Western Ontario.
