Gas-detection technology improves reservoir interpretation
New developments in gas-detection technologies, including high-speed chromatographs and microwave ovens, provide mud loggers and operators with improved means for reservoir interpretation.
The current perception of mud logging is that because of built-in errors in measurement, the gas-evaluation process is not sufficiently accurate or reliable for formation evaluation. For example, older systems suppress heavier gas measurements, while systems using dilution cause errors in the measurements of heavier gases (ethane through pentane) of up to 300%.
Yet recently, technical improvements in the area of surface gas measurement have increased accuracy tenfold to an unprecedented level of 1-5 ppm. Major improvements that are just now reaching the well site include:
- Gas chromatography (GC) instruments that are many times more sensitive and reliable than the previous generation.
- Gas traps that are more responsive to mud level and mud flow.
- Microwave systems that distill gas from a mud system far more efficiently than conventional methods.
Mud logging technology
Typically, activities at the well site involving hydrocarbon gas detection are broken down into three sets of recordings: total gas, gas chromatography, and residual cuttings gas measurement.
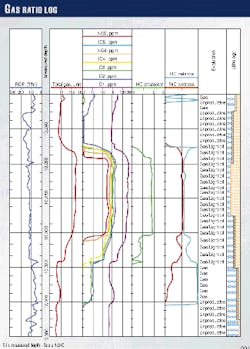
Accurate gas surface measurements can help identify the reservoir type and qualitative level of productivity (Fig. 1). Additionally, the ability to distinguish formation fluid types, including gas-oil ratios, reduces the amount of time needed for formation testing.
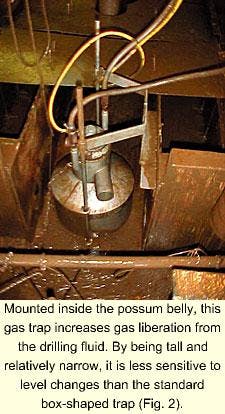
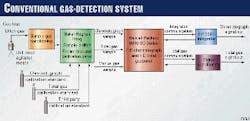
Conventionally, an agitator, mounted inside the possum belly at the end of the flow line, separates the gas samples from the drilling mud (Fig. 2). The agitator, rotating at high speeds, blends the mud so that gas is liberated from the drilling fluid.
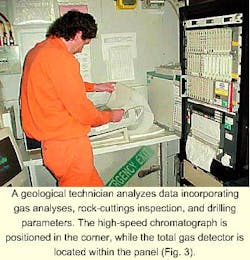
A hose, connected between the agitator and gas-detection equipment (Fig. 3), provides a continuous stream of gas that is drawn into the analyzing equipment by pneumatic pumps (Fig. 4, below).
Total gas and chromatography
The total gas detector continuously measures the presence of all gaseous hydrocarbons in the drilling mud without splitting individual constituents from one another. The combustion products formed in the detector are numerically proportional to the total number of carbon atoms in a sample.
The result is a ratio of hydrocarbons to air occurring in the mud gas (ditch) sample, computed and displayed as a total gas reading in either percentage or units (Fig. 1).
On the other hand, gas chromatography works by cycling batched quantities of ditch samples for analysis (Fig. 5). To depict gas shows, real-time readings compare concentrations of methane through butane (sometimes pentane) with background levels.
Columns separate the sample into individual hydrocarbons. Calibration occurs by passing a known mixture of gases through the chromatograph.
Cuttings gas
Additionally, through use of a microwave, gases can be extracted from the actual wet cuttings. These samples are held inside a Plexiglas container and extracted by use of a 10 or 30-cc syringe. The samples are then injected into the chromatograph's manual injection port for analysis.
In situations where gas remains trapped in the drilling fluid, a reflux-condensing apparatus can be used to extract hydrocarbons from the mud. Separation of the hydrocarbons takes place when drilling fluid is injected into a purged mud-steam-mixing chamber.
The steam acts upon the drilling fluid, releasing the gases. The gases then accumulate in the upper portion of the steam where they are extracted with a syringe and injected into the chromatograph for analysis.
Reservoir interpretation
Reservoir gas is associated with oil and water in two principal ways-as solution gas and free gas. Given suitable conditions of pressure and temperature within the reservoir, natural gas will remain in solution in the oil phase. Free gas tends to accumulate in the highest structural part of a reservoir to form a gas cap.
As long as there is free gas in a reservoir gas cap, the oil in the reservoir will remain saturated with gas in solution. Gas is usually described in two ways, dry gas and wet gas. Dry gas contains mostly methane, while wet gas contains methane, ethane, propane, iso and normal-butanes, and minor amounts of heavier hydrocarbons.
The gas curve or even chromatographic analyses by themselves provide limited value and may even be misleading. Thus, integration of ditch gas with cuttings gas, rate of penetration, lithology, and oil description make the mud log the single most powerful evaluation tool available at the well site (Fig. 1).
Furthermore, when this information is coupled with geophysical logs or logging-while-drilling data, a more comprehensive data set becomes available for interpretation.
Although complex interactions prevent personnel from relating mud-log gas shows to gas or oil in place, sufficient character remains with the gas show to allow a correlation between wells and a tentative identification of reservoir type and quality.
Thus, comparisons of gas shows encountered while drilling, aided by the evaluation of produced cuttings and later events, provide essential information for effective formation evaluation.
Gas and oil contacts
Gas shows can be used to identify special geologic conditions. Near the gas cap of an oil or condensate pool, methane often appears first, gradually becoming enriched with heavier hydrocarbons deeper into the reservoir (Fig. 1).
As oil gravity decreases (increasing density), methane and ethane become less dominant. Under these conditions, propane and butane content commonly exceed ethane.
Low cuttings gas and uniformity of cut development also typify lower-gravity crude oils. The absence of any gas accompanying an oil show indicates that a residual or water-wet reservoir has been encountered.
A low-permeability reservoir is characterized by a chromatogram rich in methane along with high cuttings gas and slow solvent cut.
Produced gas
While drilling with a close balance between borehole pressure (hydrostatic) and pore pressure, a flow into the well bore, otherwise known as connection gas, can occur when the pumps are shut down during makeup of another section of drill pipe. This influx results from a pressure reduction associated with a reversal in the value of the annular pressure loss.
When the drilling fluid is being pumped, the annular pressure loss adds to the static mud pressure so that as the pumps are shut down, this extra pressure is lost. Then, as the kelly is lifted, swab pressures further reduce the bottom-hole pressure (BHP).
In general, connection gas can indicate an underbalanced mud weight with the hydrostatic pressure at values less than formation pressure.
During a trip, the same reversal of the annular pressure drop occurs as described above. Because pipe is being removed, however, the hole must regularly be filled with mud-usually every five drill stands.
If the hole does not take enough mud to displace the volume of the withdrawn drillpipe, this may indicate that pore fluid is displacing the mud near the bottom of the hole. Swabbing can also reduce BHP and allow pore fluids to enter the well bore.
Misconceptions
Given the number of errors built into gas measurement, many workers believe mud logging is not sufficiently accurate or reliable for formation evaluation applications. Some of the problems associated with interpretation include:
- Gas may be bleeding in from a zone (produced gas) other than the lithology being drilled at the time (liberated gas).
- Gas may migrate up the hole as the fluid is circulated out, a function of buoyancy and density, causing the lithological and gas samples to become slightly displaced. In other words, gas has a tendency to float upwards in the mud system while the cuttings have a tendency to sink (cuttings lag).
- Not all the gas in the mud is recovered at the surface; some stays dissolved in the mud (entrained gas).
- Different components have different recovery rates. For example, such lighter components as methane (CH4) and ethane (C2H6) are more easily recovered than heavier components such as propane (C3H8), butanes (C4H10), and pentanes (C5H12). Additionally, there are dilution effects because of air mixing with the sample at the surface.
Breakthroughs
Recent technological advances in gas trap design, microwave distillation, and chromatography reduced these errors substantially by improving the consistency of the process used to collect gas and distill it out of the mud system.
A standard cylindrical gas-trap shape has been developed that is more resistant to variations in mud level and flow than conventional box-shaped units (Fig. 2). A motor-driven agitator shakes up the mud, allowing the gas to escape.
Standards have been developed for recommended rotational speeds and sample recovery flow rates, helping to maximize the volume of gas that is recovered for analysis.
Microwave distillation
In exceptional cases, gas may be difficult to remove from cuttings. Microwave systems have been developed to distill all of the gas out of the mud system, allowing for more-accurate quantitative measurements.
The microwave system consists of an airtight distillation chamber with small plastic tubes attached at the bottom and top. One of the tubes is used for drilling mud-sample injection; the other, for hydrocarbon gas-sample collection.
The chamber mounts inside a small microwave oven with the injection and extraction tubes extending outside the wall of the oven. The sample-injection line is fitted with a four-way valve with the common port of the valve fitted to tubing running to the distillation chamber.
The three remaining ports are used for sample injection, clearing the sample from the chamber after distillation, and monitoring chamber pressure while the sample is distilling. This method is virtually 100% effective in extracting gases from the mud system. It takes less time and is more reliable than the steam still method that, for the most part, has been replaced.
Chromatograph
Even more dramatic improvements are being seen in the instruments used to measure the gas samples. Since the 1960s, when they were first introduced to the oil field, GCs have provided the primary tool for accurate surface gas measurement.
This instrument separates a complex mixture into its components by eluting the components from a heated column packed with sorbent by means of a moving gas phase. Separation is caused by differences in the rate of elution-or movement along the column-of the various components.
The greater the affinity of a particular chemical compound for the sorbent, the longer it will be retained in the system. Quantitative information is obtained from the area under a peak plotted as a function of concentration.
Yet surface gas measurement instruments currently used in the oil industry generally represent GC technology that is at least a decade old. This is because standard off-the-shelf laboratory instruments require considerable modifications in order to make them rugged enough for oil field use.
A new technology
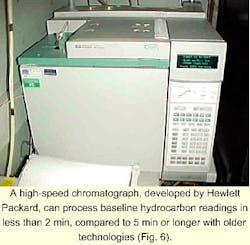
The latest generation of instruments, however, such as Hewlett Packard Co.'s HP 6890 GC (Fig. 6), utilizes an extremely sensitive flame-ionization detector (FID) that is several orders of magnitude more sensitive than the hotwire detectors of the past.
In the FID, the sample is burned in a small hydrogen flame as it is eluted from the column. Upon combustion of the organic material, charged species are formed in the flame and collected by a polarized collector electrode.
The signal is then fed to an electrometer, making it possible to detect gas component concentrations as low as 1-5 ppm. Although the detector is sensitive to nearly all carbon compounds, it does not respond to CO2, CO, H2O, O2, N2, and NH3, and the rare gases of oxides, nitrogen, and sulfur. This insensitivity to air and water is beneficial in surface gas measurements.
Additional improvements in accuracy have come from electronic pneumatics control (EPC) of the inlet pressure and improved oven temperature control. EPC in all pneumatics functions yields maximum retention time and area count reproducibility.
On-board sensors monitor ambient temperature and barometric pressure so the GC can compensate for these variables, achieving accurate and reproducible results instrument-to-instrument and run-to-run.
Six independently controlled heated zones in addition to the column oven prevent variations caused by temperature changes. Thermal isolation of valves ensures quality results independent of oven temperature cycles.
Improved field accuracy
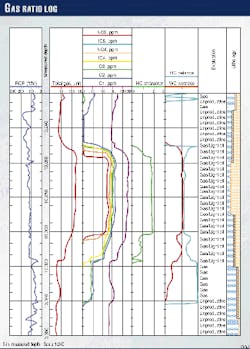
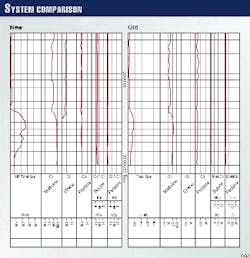
The two surface logs shown in Fig. 7 demonstrate the improvements in accuracy that can be achieved with this technology. These measurements were both taken from an offshore well in the Gulf of Mexico. Both traces show about 90 min of drilling, corresponding to a few hundred feet of penetration.
The log on the right comes from a previous-generation surface-gas measurement system, while the log at the right comes from the new system. Note the dramatic differences in the total gas measurements that represent the bottom trace on each log.
These logs show that the improved accuracy of the new system is particularly pronounced when it is measuring heavier gases and when gas concentrations are high. The new system shows that surface gas briefly reached a level of several hundred units of gas, while the older system showed a maximum reading of 100 units.
Looking closer at these readings, one can determine the reason for the dramatic differences between the two traces. The methane readings are fairly close. Note that the older system, however, does not detect any ethane at all, while the new system shows a significant ethane reading that drops off towards the end of the trace.
The propane reading is also substantially higher with the new system. Calibration measurements with a known quantity of each gas type show the new system measures all these gases with near absolute accuracy, emphasizing the improvement it provides over current methods.
In addition, the new system responds far more quickly to changes in gas composition, making it possible to detect transient conditions that would not be apparent with the earlier technology.
Fast cycle times
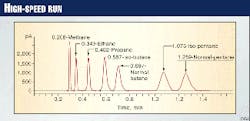
The higher accuracy of the new machines makes it possible to significantly reduce sample turnaround time while maintaining excellent separation of eluted compounds. Samples that once took 5 min to process can now be processed in less than 2 min (Fig. 5), including base-line resolution of methane through pentane.
If base-line resolution is not required, the sample can be processed in as little time as 40 sec. This means more timely readings can be taken over an interval of interest. Reducing turnaround time also improves safety by increasing the speed with which a dangerous condition can be detected.
The HP 6890 GC is configured with both channels of operation: total gas and chromatography. Both analyses are performed simultaneously. The chromatographic analysis separates and quantifies methane, ethane, propane, iso-butane, n-butane, iso-pentane, and n-pentane while back flushing the hexanes and heavier to vent.
The second channel monitors the total hydrocarbons in gas from the drilling mud for safety purposes. The gas passes directly to the second FID without chromatographic separation.
The GC was converted to oil field application, from conception to implementation in less than 1 year thanks to continuous communications, mostly on-line over the internet, between Hewlett-Packard and Baker-Hughes Inteq engineers. Field tests began in November 1998 in the U.K. on an Armada Hess rig and in the U.S. on a BP Amoco plc job in the Gulf of Mexico.
Acknowledgment
The author wishes to thank Pat McGinley, Pete Pernasilice, John Lottinville, Bill Metcalf, Mark Craber, Stuart Pressage, and Neil Weston for their contributions to this article.
Bibliography
Haworth, J.H., Sellens, M., and Whittaker, A., "Gas Ratio Log," AAPG Bulletin, Vol. 69, No. 8, August 1985.
The Author
Rob Loos is an engineering coordinator with Baker Hughes Inteq. Since 1984, he has specialized in data communications, satellite transmission, system integration, sensors, and mud logging technologies for a variety of surface and measurement-while-drilling systems. He graduated from Maritime College, Rotterdam, in 1977.
