Avoiding US oil resource surprises requires enhanced information system
David Bardin
Energy analyst
Washington, DC
This article urges action by government or the petroleum community to inform policymakers better (and confuse them less) about two energy information basics:
• Quantity of US oil resources down in the rocks.
• Degree to which oil industry can mobilize them.
Introduction
Recent growth in US oil production, especially of unconventional "tight oil" (or "shale oil") from "continuous" formations—or "source (and juxtaposed) rocks"—seems to have startled government and industry leaders here and abroad. AAPG Memoir 97, published in August 2012, examines the new shale "giant fields" worldwide.1
Lack of a comprehensive inventory and timely description of US crude oil resources are serious shortcomings of today's energy information system. Such deficits invite surprises, weaken education, and hinder policymakers in weighing plans for US energy.
As the world's largest refiner and consumer of petroleum products, its largest oil importer, and third largest oil producer, the US needs to understand the entire crude oil endowment within its borders, whether those mineral resources belong to the federal government or others.
States that produce or may come to produce crude oil have parallel interests. Coherent, coordinated, and timely resource inventories would objectively cover estimated quantities or ranges of quantities in four areas:
1. Original oil in place (OOIP) and remaining oil in place (OIP) related to anticipated ultimate recovery.
2. Resources that are probably recoverable with current technology but not yet proved.
3. Proved reserves.
4. Current and projected future production.
Today's incomplete and fragmented energy information programs fall short. Federal agencies dole out information piecemeal in uncoordinated installments. Good news gets blurred and delayed. The same could happen with bad news. Better and more current information might beget informed debates and better policy choices.
Endowment not quantitatively estimated
US petroleum industry history "is replete with instances of unanticipated 'good' resource-related surprises," as the National Petroleum Council (NPC) reported in 2011 to Department of Energy (DOE) Secretary Chu:2
"This long and continuing history of unanticipated "good" resource-related surprises begs the question as to what currently ignored and discounted oil and gas resources might have the potential to provide similar surprises in the future."
The NPC continued, "Given history's lessons about scientific and technological progress, perhaps consideration ought be given to establishment of a small but highly competent effort dedicated and resourced specifically to (1) identify and characterize those oil and gas resources not yet being quantitatively estimated (using both open-source and disclosure-protected proprietary data and information), and (2) identify, analyze, summarize, and status-assess ongoing and-or needed R&D activities, basic or applied, that may hold promise for rendering these resources technically and then economically producible at some time well into the future."
Recognized importance of oil in place
Policymakers most frequently hear that the US has less than 2% of worldwide crude oil proved reserves, the narrowest concept of the US endowment of oil resources. Yet current production and a few estimates of OOIP and of remaining in-place resources indicate much larger US shares.3
What should policymakers understand, and where do tight oil and other oil resources "not yet being quantitatively estimated" fit in?
American Petroleum Institute experts used to estimate proved crude oil reserves, production, OOIP in known oil fields, cumulative production, and anticipated ultimate recovery—both in barrels and as a percentage of OOIP. API updated and published all those estimates annually, by state and nationally, in a single report. API did not attempt to project future annual production.
API estimates of OOIP and recovery factor fell by the wayside after an Energy Information Administration (EIA), created as an independent part of DOE, took responsibility for annually determining proved reserves and publishing those findings. Several other agencies and consultants have developed in place data and recovery factors for particular US crude oil studies, but no one took up API's coherent, comprehensive, US inventory.
The National Research Council (NRC) of the National Academy of Sciences sought renewed, regular estimation of oil in place and of recovery factors by the Department of the Interior (DOI) but to no avail. The NRC urged:
"Resource assessments should, but rarely do, begin with a calculation of in-place resources: the total volume of petroleum trapped within the play being assessed, without consideration of whether or not the petroleum is extractable. Instead, assessments typically limit their evaluation to resources recoverable with conventional technology. Thus, when assessors consider what resource volume exists in a petroleum field, they weight their considerations with a judgment about how much of the resource is recoverable.…"
NRC continued, "The distinction between in-place resources and recoverable resources arises because a substantial part of the earth's total petroleum content is either dispersed at very low concentrations throughout the crust or is present in forms that cannot be extracted except through methods that would cost more than the petroleum is worth. An additional portion of the total petroleum resource base cannot be recovered because available production technology cannot extract all of the in-place crude oil and natural gas even when these resources are present in commercial concentrations. This is particularly important for crude oil;.…
"The inclusion of oil and gas resources in the category of technically recoverable or technically unrecoverable is at best a snapshot in time, and, if history is to judge, one destined to be quickly rendered obsolete. The development of improved technology continually causes resources to move from the unrecoverable to the recoverable portion of the resource base," the NRC said.4
The NPC's 2007 report to DOE Secretary Bodman observed:5
"Endowment refers to the earth's physical store of potential energy sources: …barrels of oil….
"Recoverable resources are a subset of the hydrocarbon endowment.…
"The natural endowment is the foundation of all supply projections…. The wide range of assessments creates uncertainties for policymakers.
"Current endowment and resource assessments for oil… indicate very large in-place volumes and resource potential, several times the cumulative produced volumes and current reserve estimates….
"The key consideration…is converting the resource endowment to economically and environmentally viable production and delivery," the NPC reported.
Only once has EIA reported on OIP. In 2008 EIA assembled estimates of US and global conventional and unconventional liquid petroleum resources, including crude oil and lease condensate, explaining:6
"The IEO2008 oil production projections were limited by three factors: the estimated quantity of oil in place before production begins ("petroleum-initially-in-place" or IIP), the percentage of IIP extracted over the life of a field (ultimate recovery factor), and the amount of oil that can be produced from a field in a single year as a function of its remaining reserves.… The estimate of IIP resources includes both recoverable and unrecoverable resources.... Typically, estimates of the current recovery factor for a particular field increase over time, reflecting the effects of three interrelated factors: technology, economics, and knowledge about the field."
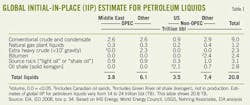
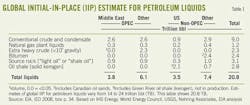
EIA's US OOIP estimates in 2008 were some 10% of global estimates both for tight oil in "source rocks" (300 billion bbl) and conventional crude oil and lease condensate (900 billion bbl) (Table 1). However, EIA was ahead of the pack in estimating US OOIP of tight oil in source rocks.
• The NPC's 2011 report reflected EIA's IEO2008 OOIPs and developed cumulative production data of 200 billion bbl for the US and 1,200 billion bbl globally.7
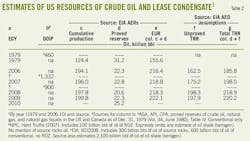
• The NPC's 2007 report had discussed estimated US OOIP of 1,332 billion bbl in the context of extraction technologies opportunities studied for DOE's Office of Fossil Energy (FE) (Table 2).8
OOIP data encouraged the petroleum community to raise US oil recovery efficiencies by technology improvements—precisely what has begun to happen for "tight oil" resources, as well as reserves growth by means of enhanced oil recovery (EOR) and efforts to exploit residual oil zones (ROZs) below oil-water contact levels—resources not being quantitatively estimated.9
EIA does publish running accounts of cumulative production, in Annual Energy Reviews (AERs), and annual proved reserves reports. Otherwise, it focuses on unproved technically recoverable resources (TRR), to which the NRC referred, as a key factor in projecting future production in Annual Energy Outlooks (AEOs) (Table 2).
EIA rightly sees resources in the rocks as indispensible ingredients to future production. But EIA's goal has not been to provide a comprehensive inventory or assure that others do so. Nor do other federal agencies or nongovernmental agencies have such a goal today.
Significance of OIP for 'tight oil'
Challenges posed by large potential tight (shale) oil resources make oil in place all the more significant. Petroleum geochemist Dan Jarvie postulates in the first chapter of AAPG Memoir 97:
"Although shale-oil plays with oil stored in open-fractured shale have been pursued for more than 100 years, organic-rich and low-permeability shales and hybrid shale-oil systems [i.e., "where organic-rich and organic-lean intervals are juxtaposed"] are now being pursued based on knowledge and technologies gained from production of shale-gas resource systems and likely hold the largest untapped oil resource potential. Whereas fractured and hybrid shale-oil systems have the highest productivity to date, organic-rich tight shales are the most difficult to obtain high oil flow rates because of ultralow permeability, typically high clay and low carbonate contents, and organic richness whereby adsorption plays a role in retention of petroleum.… Recent announcements of the oil resource potential of several shale-oil resource systems have substantiated the volume of oil they contain.… However the keys to unlocking these high volumes of oil are not fully understood or developed to date," Jarvie wrote.10
Twenty years earlier, Leigh Price and Julie LeFever concluded in a seminal 1992 paper that "faulting and fracturing of mature source rocks may be necessary for efficient expulsion of generated hydrocarbons from such rocks. Without such faulting, generated hydrocarbons may largely remain in cracks, fractures, parting laminae, and matrix porosity in both source rocks and in the rocks immediately adjacent to them. It follows that a huge oil-resource base may be present in and adjacent to fractured, mature, self-sourced shales.
"The shales of the…Bakken Formation provide insight into this proposed resource base. Both historic production data from vertical Bakken wells and Rock Eval analyses of close-spaced core and cuttings from mature basinal Bakken shales demonstrate significant movement of hydrocarbons from Bakken shales for at least 50 ft (15 m) into adjacent units. Migration probably occurred through vertical fractures created by fluid overpressuring during intense hydrocarbon generation. It is widely believed that the Bakken shales are the source of most of the conventional oil in the Williston Basin. However, newer geochemical analyses suggest that this is not the case. The Bakken shales are calculated to have generated over 100 billion bbl of oil (15.9 × 10⁹ cu m). If this oil did not charge the conventional oil reservoirs, we can only conclude that it remains in the shales and in the rocks adjacent to them."
Price and LeFever continued, "Numerous other self-sourced, fractured shale reservoirs produce oil commercially. If the thin Bakken shales have generated 100 billion bbl, then it is possible that the Lower 48 states of the US contain an unrecognized oil-resource base in the trillions of barrels. However, economic recovery of this possible resource base would depend on development of new exploration, drilling, completion, and production techniques appropriate to the nonclassical reservoir characteristics of this oil resource base."11
U.S. Geological Survey (USGS) scientists and DOE personnel discussed these ideas, deciding not to pursue them:
"The USGS recognizes the Bakken as a member of a family of source-reservoir system[s] that has a large potential but is poorly understood.... The USGS would be pleased to work with the DOE to help define specific problems to be addressed. However, the USGS is not requesting either the scientific or technical aspects of demonstrating the potential of the Bakken."12
In 1993 some in the USGS dismissed the idea of "trillions of barrels" of tight oil in or adjacent to US source rocks. Today, one hopes, agencies themselves, think tanks, and other institutions would provide forums for airing such conflicting professional views in public debate (as well as behind closed doors).
Methodologies for estimating OIP and TRR
Estimating OIP (as well as undiscovered or otherwise unproved TRR) begins with defining pertinent volumes of oil-charged rock to be assessed. A small study may look to rock volumes within lease boundaries (depth as well as area) or a targeted portion of such volume. A larger-scale USGS study will examine a Total Petroleum System (TPS) in light of available geoscience: geology, geophysics, geochemistry.
A full TPS investigation requires explaining origins of known petroleum occurrences in three dimensional space, through time, and then suggests where undiscovered deposits may be found in the rock volumes being assessed. A TPS consists of essential elements (source, reservoir, seal, and overburden rocks) and processes (generation-expulsion-migration-accumulation and trap formation) as well as genetically related petroleum in seeps, shows, and accumulations.
With area and thickness selected, there are two approaches to estimating OIPs or OOIPs. A complex, large-scale approach that some petroleum geochemists follow seeks to understand petroleum generation, migration, entrapment, and leakage or erosion for a basin in detail. A more common approach (used both small- and large-scale) more directly addresses how much oil is in rock volumes today, without reconstructing history.
Under either approach, application of a recovery factor to the in-place estimate (based on formulas for conventional resources, general experience, or conjecture) then yields a recoverable resource figure. Recovery factor selection involves reservoir engineering considerations and analysis of well production histories, if any, geared to available technologies.
The most common approach interprets all available geophysical data, wireline logs, and analyses of cores and cuttings to estimate oil per unit of rock in one or more portions of the total rock volumes being studied. It also subtracts any cumulative production to determine remaining OIP.
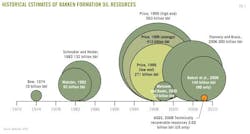
Historical estimates of Bakken formation resources exemplify a complex petroleum geochemistry approach (Fig. 1).13 Bakken investigators examined evidence of mass balances and thermal maturity of organic matter in various portions of the rock volumes, postulated a sequence of chemical and physical processes, estimating amounts generated, how molecular chemistry changed volumes, pressures, and fractures, possible migration pathways and quantities, characteristics of oils as generated and accumulated, and quantities lost to cumulative production, leakage, or exposure. This kind of investigation digs deep into theory and analytic techniques and may perfect, amend, or challenge widely held views14 (or even deviate from a standard methodology, provoking effort to thwart public dissemination of such scientific views on that ground.15) Price and LeFever's seminal paper cited above concluded that huge quantities of oil generated in the two Bakken source rock shales had not migrated upward beyond the TPS but rather remained in the two source rocks or juxtaposed rocks (lower Lodgepole, Middle Member, and Three Forks).
• If virtually nothing has migrated, oil generated equals oil in place.
• If there has been significant migration, it behooves investigators to estimate how much. That 1992 paper argued for early EOR programs (still on today's research agenda) as well as for new completion and production techniques attuned to unique resource and fracture system characteristics.
A production-based approach is another way to estimate recoverable resources. It skips OIP and avoids estimation of recovery factors. This approach uses estimated ultimate recoveries (EURs) for future wells which it bases on anticipated EURs for some of the wells now producing in parts of the rock volume being studied (or analogs elsewhere if sufficient wells data are lacking).
Assessors' judgments involve geology and reservoir engineering as well as statistical considerations. Thus in applying well-performance methodologies, USGS geoscientists and engineers may discard some wells as statistical outliers and EIA staff professionals may discard older vertical wells where it appears only horizontal wells will develop an unproved resource. Nonetheless, assessments "are tied to current engineering practice" with "no estimate of volumes recoverable by future technologies."16
Timing of fragmented US resource reports
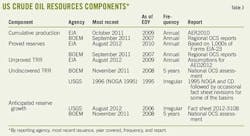
In contrast to API's single, annual, consolidated reports (which ended 32 years ago), today's reports come out on a variety of schedules, independently of one another, from three government agencies: EIA, DOI's Bureau of Ocean Energy Management (BOEM) and its predecessors, and USGS (Table 3). Each agency report issues in isolation. There is no agreed national framework or context into which readers/users are invited to fit data newly released.
EIA has reported OOIP only once. BOEM makes, but does not publish, OOIP and recovery factor estimates in the course of lease management.17 USGS has used OOIP data prepared by others (which are largely proprietary) and recovery factor estimates in assessing reserves growth potentials of large individual accumulations.18
USGS has refined its science-based geologic expert opinion assessment process for estimating undiscovered TRRs over many years. It always provides probabilistic ranges (as well as means) for both TRRs and other assessments. USGS posts descriptions of its methodologies for conventional and continuous resources and reserves growth.
EIA largely relies on USGS mean estimates for unproved TRR onshore (and on BOEM for offshore). But EIA needs annually adjusted data for its AEOs. USGS cannot work that fast. So EIA updates and sometimes revises USGS estimates.
Quantities estimated, assessed, published
National and global perspectives
US proved reserves of crude oil and lease condensate were 25 billion bbl of oil as of the end of 2010 per EIA.19
EIA compares US proved reserves estimates with those of other countries, as published by Oil & Gas Journal—warning that "proved reserves are not an appropriate measure for judging resource availability in the long run. For example, despite continued production, global reserves historically have not declined as new reserves have been added through exploration, discovery, and reserve replacement."20 (EIA has yet to publish estimates of tight oil proved reserves. See regional discussion, below.)
US cumulative production of crude oil and lease condensate was an estimated 200 billion bbl as of end-2009, an increase of 75 billion bbl over 30 years during which proved reserves declined by 9 billion bbl per EIA (Table 2).21
Production of tight oil, mostly still in its infancy, cannot have contributed much as yet to cumulative production.
EIA estimated 33 billion bbl of unproved TRR of tight oil in eight of the resource plays as of end-2009 for its AEO2012 (out of 113 billion bbl of total Lower 48 onshore unproved TRR).22 EIA has no tight oil components in its estimated TRRs for Lower 48 offshore (50 billion bbl) or Alaska (35 billion bbl). EIA is working toward a November 2012 revision of tight oil estimates as of end-2010 for some of the resource plays to use in its AEO2013. (Forthcoming unproved TRR of tight oil underlying EIA's AEO2013 seem likely to exceed 33 billion bbl.)
The NPC reported to Secretary Chu:
"The United States' oil resource base has increased over time due to technology enhancements and a greater understanding of new "frontiers." The US oil in place endowment (the broadest possible definition of the resource) for conventional reservoirs is about 11% of the world's total, while the country's unconventional reservoirs are 23%."23
API's final national estimates included OOIP of 460 billion bbl at end-1979, of which 32% would ultimately be produced (148 billion bbl, consisting of 121 billion bbl of cumulative production plus 27 billion bbl of remaining proved reserves), all conventional (Table 4).24 Williston basin OOIP accounted for less than 8 billion bbl of API's 460 billion bbl.
Two decades later, national OOIP has more than doubled because industry reached out, physically and intellectually, probing further and deeper into rocks not accessed commercially before (or barely accessed). Williston basin OOIP skyrocketed. ND proved reserves rose by 1.3 billion bbl in just 2 years (end-2008 to end-2010) almost to 1.9 billion bbl.
Bakken/Three Forks tight oil in US Williston
North Dakota has sought to understand Bakken formation resources within its borders as production of Bakken oil in the state has risen well over a hundred fold from under 5,000 b/d in April 2006 to 545,000 b/d 6 years later and even more today. The state's Department of Mineral Resources (DMR) currently estimates more than 300 billion bbl of OOIP in the Bakken and Three Forks formations within the thermally mature portion of North Dakota (7-9 million acres) but has not issued a full report:
"Bakken…ultimate recovery using current drilling and completion practices has been estimated at between 2.5-5.0% of [OOIP], which is equal to 7-15 billion bbl. [North Dakota Bakken] wells are still undergoing adjustments and modifications to the drilling and completion practices. Technology and the price of oil will dictate what is ultimately recoverable from this formation. A 1% increase in recovery equals 3 billion bbl.…"25
Earlier, detailed North Dakota reports had used standard industry volumetric methodologies to estimate OIP within a volume of rock and then applied recovery factors, related to present technology, to derive estimated recoverable resources.
• DMR and the North Dakota Geological Survey (NDGS) used such volumetric methodologies for large drilled and undrilled areas (on the scale of counties and a group of counties in ND).
• Two explanatory reports published in 2008 and 2010 respectively estimated:
—149 billion bbl in place for the Bakken formation alone (consisting of upper and lower Bakken shales and a Middle Member but excluding the Three Forks formation below the lower shale) with 2.1 billion bbl being recoverable by existing technology.
—20 billion bbl more in place for the upper 50 ft of the Three Forks, with 1.9 billion bbl being recoverable.
• These reports applied averages of recovery factors presented at DMR hearings to estimated OIPs.
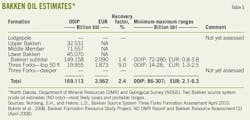
In addition to "most probable" estimates (above), DMR and NDGS published minimum-maximum ranges, as well as separate OOIPs for each member of the Bakken formation (Table 5).
Experience since 2010 indicates oil saturation in the Three Forks beneath the upper 50 ft which North Dakota analyzed.
North Dakota's sovereign, general government responsibilities predominate. That state owns only 6% of Bakken mineral estates and 2% of surface interest.26
EIA has not published estimated proved reserves for the Bakken play, but its 1.4 billion bbl proved reserves estimate for the Williston basin (Montana + North Dakota + South Dakota) as of end-200927 probably includes over 1 billion bbl of Bakken reserves.28
EIA assumed for AEO2012 that 5.4 billion bbl was the estimated Bakken unproved TRR at end-2009 for North Dakota and Montana combined (compare DMR's most recent 7-15 billion bbl for North Dakota alone).
• EIA's 5.4 billion bbl Bakken estimate revised and updated (in 2012) a USGS assessment of 3.6 billion bbl (mean value) released in 2008 (which had, in turn, replaced USGS's mean assessment of 151 million bbl in 1995).
• EIA previously (in 2007) added 3.6 billion bbl of Bakken oil as of end-2004, revising USGS's 151 million bbl.29
Alerted to Bakken development,30 EIA had posted in 2006 a "first in a series of reports…on technology-based oil and gas plays" which discussed recent OOIP and recovery factor data from Headington Oil Co. (a Montana Bakken pioneer), earlier OOIP estimates by USGS petroleum geochemist Price, and TRR estimates, including EIA's decision as to USGS's estimate.31
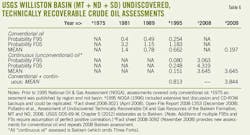
USGS published its first estimates of unconventional, continuous crude oil resources such as the Bakken Formation in 1996 in its 1995 NOGA. USGS published explanatory texts and CDs giving insights as to judgments underlying its 1995 NOGA (Table 6).
A history of USGS Williston Basin assessments is instructive. Before 1995, USGS treated Bakken shales solely as source rocks from which oil had migrated to Madison formation reservoirs above. The 1995 NOGA treated the Bakken formation as both source rock for Madison reservoirs and reservoir rock. USGS found that "available evidence indicates that the Bakken formation (both states) has generated hundreds of [billions of barrels of oil]" and "the Bakken formation forms a continuous, self-sourced reservoir containing an enormous volume of oil in place."
But USGS did not quantify either how many "billions of barrels" the Bakken had generated or how many billion bbl comprise the "enormous" volumes of remaining oil in place. And USGS continued to identify Bakken shales as source rocks for Madison oil.32
USGS's assessments in 2008 did not discuss Bakken migration. It took 4 more years for release of DDS-69W, with seven chapters discussing 2008 USGS assessments; its chapter on the Madison formation concludes that Bakken-source oil had not charged Madison reservoirs as previously thought.33 In both 1995 and 2008, USGS used productivity-based methodologies to extrapolate EURs of wells for each of five Bakken assessment areas. Areas with little or no drilling history were assessed in reliance on analogs. USGS limited itself to portions of the Bakken system comprising the upper and lower Bakken shale source rocks and intermediate Middle Member of more brittle rocks. It did not assess the Three Forks formation adjacent to and beneath the lower Bakken shale.
USGS is now working on another revision and update, scheduled for completion in 2014, which will assess also the Three Forks formation. USGS will adhere exclusively to productivity-based estimates and not use estimates by others of oil in place. Its results will be subject to replication.34
Eagle Ford, Alaska, federal offshore
Eagle Ford. EIA assumed 2.5 billion bbl of unproved TRR tight oil in Eagle Ford shale source rocks in Texas as of end-2009 for its AEO2012. EIA is working toward a November 2012 revision and update for its AEO2013.
• In 2011 USGS assessed a mean of 850 million bbl in a range of 340 million bbl (P95) to 1.69 billion bbl (P5).35
• USGS plans a revision and update, hopefully by the end of 2013.36
Alaska. EIA assumed 35 billion bbl of unproved TRR in Alaska (onshore and offshore, combined) as of end-2009 for its AEO2012, including no tight oil. In 2012 USGS assessed a mean of 1 billion bbl in a range of 0.0 billion bbl (P95) and 2.0 billion bbl (P5) of unproved TRR tight oil in three Alaska North Slope source rocks.37 It is uncertain whether that will affect EIA's AEO2013.
Federal offshore (OCS). EIA assumed 50 billion bbl of Lower 48 offshore unproved TRR (all conventional oil), as of end-2009 for its AEO2012, based on estimates made by BOEM staff. BOEM prepares estimates at various stages of preleasing, leasing, and lease administration processes. At some stages, BOEM regions estimate OOIPs and recovery factors, using standard industry formulas.
BOEM publishes the formulas but not the OOIPs or recovery factors, only the resulting TRRs. BOEM does not update its OOIPs throughout lease history. After a lease goes into sustained production, BOEM shifts to a production-based methodology to predict ultimate recovery.
BOEM uses "endowment" more narrowly than concepts used or advocated by the NPC, IEO2008, and NRC (to mean cumulative production, plus proved reserves, plus estimated reserves growth, plus unproved TRR).
Reserves growth, EOR, and ROZ
BOEM estimates 9.5 billion bbl of federal offshore reserves appreciation (growth), all in the Gulf of Mexico.38
USGS estimates 32 billion bbl of reserves growth potential (mean value) in discovered onshore conventional fields, of which 22 billion bbl were in 68 accumulations individually assessed and 10 billion were in 9,168 accumulations assessed by regression analyses.39
USGS assessments of 68 specific accumulations start with OOIPs estimated by others and apply incremental recovery factors to reflect potentials for more EOR. The OOIPs are from proprietary sources and cannot be disclosed. These USGS assessments cannot be replicated by outsiders.
It appears that EIA will not use these BOEM and USGS estimates (or any ROZ estimates) in its AEO2013. Federal agencies have not recently published quantified estimates of OIPs in ROZs below the oil-water interfaces of conventional accumulations.40
Discussion
It would help to have an overall resource template into which to fit particular data as reported, even apart from providing more comprehensive data than are being reported today.
EIA and DOI agencies (BOEM and USGS) dole out information piecemeal, in uncoordinated installments—some at predictable intervals, some infrequently (Table 3). Agency professional staffs work diligently to prepare their reports despite resource limitations. But end results do not rise to a comprehensive inventorying of US crude oil resources.
The NPC's new insights in 2011 as to large (yet hardly measured) additional in-place resources of "tight oil" in continuous source-rock (or juxtaposed) formations add force to observations of NPC's 2007 report illustrating pertinence of in-place oil data to policy:41
"Large volumes of technically recoverable, domestic oil resources…remain undeveloped and are yet to be discovered from undeveloped remaining oil in place of over a trillion…barrels.… This resource includes undiscovered oil, stranded light oil amenable to CO2-EOR technologies, unconventional oil (deep heavy oil and oil sands), and new petroleum concepts, such as residual oil in reservoir transition zones. As a leader in EOR technology, the US industry faces the challenge of further applying this technology towards economically producing the more costly remaining domestic oil resources.
"While pursuing this remaining domestic oil-resource base poses considerable economic risk and technical challenge to producers, developing the technical capability and infrastructure necessary to exploit this resource reduces our dependence on foreign energy sources and helps our domestic energy industry maintain worldwide technical leadership," the NPC said.
Policymakers could better understand US resource posture if given insights into OIP and recovery efficiencies of available technology on a national and regional scale with reasonable frequency. Recovery factors data (including estimates for tight oil resources) could help bring attention of federal and state policymakers and the research community (as well as the operators) to extremely great challenges. Some see tight oil challenges as akin to enhanced EOR challenges. One expects OIPs will continue to rise and recovery factors to be critical.
An information system that ignores OIPs will consequently ignore percentage estimates of recovery as well.
• Reasons for estimating and reporting crude oil OIPs would not dictate annual or biannual frequency.
• Estimated OIPs would be for rock volumes where oil production is a reality or deemed a real opportunity in the foreseeable future, but not for low-concentration molecules dispersed in the crust or potential self-sourced reservoirs in rocks which do not appear accessible by any technology on the horizon.
Comprehensive OIP estimates would include but clearly flag resources that are closed to drilling. EIA now excludes from its consideration TRR in areas where (a) drilling is prohibited or (b) no leasing of publicly owned mineral rights is planned during an AEO's projection years.
Congress and the Executive Branch could direct a federal agency to prepare such estimates or arrange to have a nongovernment body undertake the job. Or the impetus might come from outside of the federal government. One possible model might be the Potential Gas Committee (PGC), which produces an extensive gas resource report every 2 years.
Although this independent, nonprofit committee of mostly industry-based, volunteer estimators does not publish its original gas in place (OGIP) and recovery factor estimates, its frequency of TRR reporting and the comparatively high recovery factors for conventional natural gas reservoirs may have made OGIPs seem less critical. For example, PGC's estimates timely reflected the recent large increase of recoverable tight gas resources.
If the federal government and national petroleum community are not yet prepared to lead to a more robust national system of crude oil resources information, some producing states might show the way.
Estimating recovery factors for tight oil poses uncertainties.
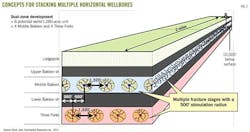
• Engineering techniques vary among source rocks, within a single formation, among operators, and over time. Horizontal drilling and hydraulic fracturing progressed incrementally. Big challenges remain (Fig. 2).42
• Concepts need clarification: Is recovery efficiency estimated for an entire volume of rock in a lease (or well spacing area) or only for a part of that volume, in cylinders around well bores into which fractures drain?
Resources data (OIP, proved reserves, unproved TRR) are necessary but not sufficient to assess US potentials.
• EIA algorithms for its AEOs consider much more (e.g., well drilling costs). EIA's reports on assumptions for each of the AEOs disclose several parameters considered.
• Drilling is essential both to offset rapid declines in output per tight oil well and to raise total production. However productivity progress may raise the value of each well rather rapidly.
• BOEM's 5-year OCS assessments relate future recoveries to a wide band of future oil prices.
• North Dakota occasionally projects future production, explaining key metrics such as drilling of tens of thousands of wells over a period of years. The state seeks to anticipate implications of rising gas-oil production ratios.43
• Outsiders can review and challenge published projections: Thus energy consultant Mason saw potentials for 1.5-2.5 million b/d of Bakken peak production (higher than North Dakota projections at that time).44
Robust, timely crude oil resources inventorying requires practical means not now in place. USGS methodologies for estimating TRRs and reserve growth are labor-intensive and time-consuming. USGS's program does not satisfy even EIA's annual needs, hardly keeps up with important resource plays, and does not deal quantitatively with reserve growth potentials such as ROZs. Timing of some BOEM estimates pose issues. The task remains to design an adequate comprehensive, timely information program addressing the full endowment.
In order to minimize resource surprises, the NPC in 2011 also suggested adequate tracking of public and private science and technology R&D with a specific focus on discoveries, upcoming improvements, and entirely new approaches that are likely to improve recovery factors in the future, or to result in the recovery of presently unrecoverable resources.
Such foreknowledge would well serve projecting resource availability and production potential for many future decades. But discussion of such an effort is beyond the scope of this article.
Lessons learned
The US should not skimp on timely data, deep analyses, and informed debate about its own resources as well as those of its good neighbors and other trading partners.
Resource estimates are fraught with uncertainty for conscientious professionals, which policymakers ought to appreciate. There is room for strong disagreement.
But restricting policymakers' knowledge for fear of inherent uncertainties seems liable to trip them up by overlooking both complexities and opportunities. Why should a nation endowed with precious crude oil resources lack a realistic inventory of its entire endowment despite the challenges?
Acknowledgments
The author gratefully acknowledges information and suggestions received from Thomas S. Ahlbrandt, Philip M. Budzik, Ronald R. Charpentier, Guido Dehoratiis, Richard P. Desselles Jr., Jackie Forrest, Steven G. Grape, John H. Guy IV, John A. Harju, Lynn D. Helms, Daniel M. Jarvie, Donald A. Juckett, Julie A. LeFever, Gary Long, Steven Melzer, David F. Morehouse, Stephan H. Nordeng, Kevin P. Regan, Andrew J. Slaughter, John Staub, Harold Syms, and other NPC participants, staff and alumni of BOEM, EIA, USGS, Montana and North Dakota agencies.
References
1. Breyer, J.A., ed., "Shale reservoirs—giant resources for the 21st century," 2012.
2. National Petroleum Council, "Prudent development," 2011, pp. 59-60, and "Oil and gas geologic endowment," Topic Paper No. 1-2.
3. This article uses both "OIP" and "OOIP." Many now prefer OIP since oil may not be in its "original" trap today.
4. Committee on Undiscovered Oil and Gas Resources, National Research Council, "Undiscovered oil and gas resources: an evaluation of the Department of the Interior's 1989 assessment," National Academies Press, 1991, pp. 23-24.
5. National Petroleum Council, "Hard truths," 2007, p. 90, and "Geologic endowment," Topic Paper No. 10.
6. Energy Information Administration, International Energy Outlook 2008 (IEO2008), September 2008, box at pp. 34-35. Also, Mayne and Staub, "Incorporating international petroleum reserves and resource estimates into projections of production," EIA discussion paper, 2011, Fig. 8, p. 16.
7. NPC, "Prudent development," Topic Paper No. 1-2, 2011, Fig. 48, p. 69.
8. NPC, "Hard truths," 2007, p. 184, and Topic Paper No. 1-2, p. 2.
9. NPC, "Prudent development," 2011, pp. 102 (TZ/ROZ), 103, 110 (EOR), and 120-122 (tight oil).
10. Jarvie, D.M., "Shale resource systems for oil and gas, Part 2-Shale-oil resource systems," AAPG Memoir 97, Ch. 1-Part 2, 2012, p. 90.
11. Price, L.C., and LeFever, J.A., "Does Bakken horizontal drilling imply a huge oil-resource base in fractured shales?," in "Geological studies relevant to horizontal drilling: Examples from western North America," Schmoker, J.W., Coalson, E.B., and Brown, C.A., eds, 1992, p. 199.
12. DOE Correspondence Close-Out by Meeting (4-13-93), accessed at www.undeerc/Price (2012). In 1995, the USGS National Oil and Gas Assessment (NOGA) still adhered to the challenged view "that the Bakken shales are the source of most of the conventional oil in the Williston basin." See Regional estimates and perspectives, below.
13. After Sorensen et al., final report for DOE National Energy Technology Lab (NETL): Subtask 1.2—Evaluation of key factors affecting successful oil production in the Bakken formation, North Dakota, 2010, p. 1.
14. See Price, "Origins and characteristics of the basin-centered continuous-reservoir unconventional oil-resource base of the Bakken source system, Williston basin," unpub., 1999, accessed at www.undeerc.org/Price (2012).
15. Letters from USGS to US Sens. Byron L. Dorgan and Kent Conrad [dated May 24 and Dec. 28, 2006] and North Dakota Gov. John Hoeven, Agriculture Commissioner Roger Johnson, and Attorney General Wayne Stenehjem [all dated Sept. 25, 2006] objected to dissemination of an extensive, iconoclastic paper about tight oil resources whose author died in 2000 before completion of peer review and publication because that paper "did not utilize the standard assessment methodology."
16. Charpentier, R.R., and Cook, Troy A., "USGS methodology for assessing continuous petroleum resources," Open File Report 2011-1167, 2011, posted at http://energy.usgs.gov/OilGas/Assessment/Methodology.aspx.
17. See Reserves Estimation—US BOEM, 2011, Slide 38/94.
18. See USGS Fact Sheets 2012-3050 and 2012-3051 (both April 2012) for San Joaquin and Permian basins.
19. EIA, "US crude oil, natural gas, and natural gas liquids proved reserves, 2010," August 2012 (most recent), Table 6 (based on Form EIA-23 reports from operators). It had less EIA analysis than previous annual reports.
20. EIA, IEO2011, September 2011, p. 38.
21. AER2010, October 2011, p. 99, Table 4.2.
22. EIA, "Assumptions to the Annual Energy Outlook 2011," p. 114, Table 9.3 (and p. 112, Table 9.1). The eight tight oil plays were Austin chalk, Eagle Ford shale, Woodford shale, Avalon/Bone Spring shale, Spraberry, Niobrara, Bakken, and Monterey/Santos shale.
23. NPC, "Prudent development," 2011, p. 64. NPC's unconventional oil, taken from IEO2008, included 2,100 billion bbl of oil shale (kerogen) as well as 300 billion bbl of source rocks tight oil.
24. AGA, API, CPA, "Proved reserves of crude oil, natural gas, and natural gas liquids in the United States and Canada as of Dec. 31, 1979," Vol. 34, June 1980, Table IV.
25. Helms, L.D., Testimony on "North Dakota's Bakken Resources," for US House of Representatives, Committee on Energy and Commerce, Subcommittee on Energy and Power, Aug. 2, 2012.
26. Per Helms testimony (reference 25): ND Bakken mineral ownership is 82% private, 12% federal and Indian Trust. Surface ownership is 82% private, 9% federal and Indian Trust.
27. EIA, "Geologic distribution of US proved reserves, 2009," 2011, Table 3. Williston basin ranked fifth in the nation with 6.2% of the 22.3 billion bbl US total. End-2008 reserves of 850 million bbl rose by 540 million bbl to 1.39 billion bbl notwithstanding 110 million bbl of production during 2009. Contrast API's final estimates. See Table 4.
28. Steven Grape, EIA, personal communication, July 2012.
29. Assumptions to the AEO2007, pp. 94 and 105 [note 87], based on estimates by an independent consultant (Advanced Resources International).
30. Letter to EIA Administrator Caruso dated Nov. 30, 2005, accessed at www.undeerc/Price (2012).
31. Grape, S.G., "Technology-based oil and natural gas plays: Shale shock! Could there be billions in the Bakken?," November 2006, 9 pp.
32. Peterson, J.A., in NOGA, "1995 Geologic Report, Williston Basin Province (031)," and Schmoker, J.W., "Unconventional Plays," included therein, at pp. 3 and 9. Price and LeFever, 1992, was not referenced.
33. USGS Williston Basin Province Assessment Team, "Assessment of undiscovered oil and gas resources of the Williston Basin Province of ND, MT, SD, 2010," USGS Digital Data Series 69-W, 7 chaps., 1 CD-ROM, 2011 (released 2012), especially Ch. 4 (Madison) and 5 (Bakken). References do not include Price and LeFever, 1992.
34. Brenda Pierce, USGS, personal communications, June 2012.
35. USGS Fact Sheet 2011-3020, March 2011, Table 1.
36. Brenda Pierce, personal communication, August 2012.
37. USGS Fact Sheet 2012-3013, February 2012.
38. BOEM Fact Sheet RED-2011-01a, November 2011, Table 3.
39. USGS Fact Sheet 2012-3108, August 2012 + Fact Sheets 2012-3050 and 2012-3051, both April 2012, regarding San Joaquin and Permian basins, respectively.
40. But see teasing DOE release dated July 20, 2012, Vast energy resources in [ROZs], FE Study Says.
41. NPC, "Hard truths," 2007, p. 182 et seq.
42. After Stark, J., "Bakken shale: Evolution of a giant oil field," Slide 23/25 presented at NAPE, Feb. 16, 2011. See also Continental Resources investor update, Slide 10/22, May 4, 2012, "Bakken Development Plan," and Slide 14/24, Aug. 10, 2012, "Charlotte Unit: First 3rd Bench Three Forks Test."
43. Bentek Energy, "The Williston Basin: Greasing the Gears for Growth in North Dakota," July 2012.
44. Mason, J., "Bakken's maximum potential oil production rate explored," OGJ, Apr. 2, 2012, p. 76.
The author
David Bardin ([email protected]) is a retired member of Arent Fox LLP. He served as Deputy Administrator of the Federal Energy Administration (1977), administrator of DOE's Economic Regulatory Administration (1977-79), and on staff of the Federal Power Commission (1958-69). He is a graduate of Columbia College, Columbia University Law School, and the Bronx High School of Science.
