Gas network model allows full reservoir coupling
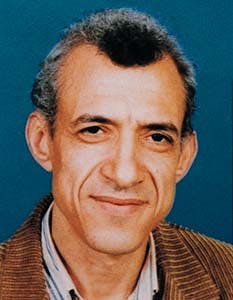
Mabruk M. MethnaniQatar General Petroleum Corp.The gas-network flow model (Gasnet) developed for and added to an existing Qatar General Petroleum Corp. (OGPC) in-house reservoir simulator, allows improved modeling of the interaction among the reservoir, wells, and pipeline networks.
Doha, Qatar
Gasnet is a three-phase model that is modified to handle gas-condensate systems. The numerical solution is based on a control volume scheme that uses the concept of cells and junctions, whereby pressure and phase densities are defined in cells, while phase flows are defined at junction links.
The model features common numerical equations for the reservoir, the well, and the pipeline components and an efficient state-variable solution method in which all primary variables including phase flows are solved directly.
Both steady-state and transient flow events can be simulated with the same tool. Three test cases show how the model runs.
One case simulates flow redistribution in a simple two-branch gas network. The second simulates a horizontal gas well in a waterflooded gas reservoir. The third involves an export gas pipeline coupled to a producing reservoir.
Gas network simulation
Gas network simulation packages have been traditionally based on a rudimentary treatment of the upstream reservoir effects, through the use of some form of the back-pressure equation coupled with a material balance representation. 1 The results usually depend on input coefficients derived from specific well tests.The assumption that these coefficients are constant and representative of the reservoir conditions at all times cannot be justified. In addition, there are well-known limitations to the validity of a simple material balance representation of the reservoir.2
To address these limitations, some network packages have been built with an interface to vendor-specific reservoir simulators.3 4 In our modeling approach, we build on the flexible structure of a previously developed reservoir model,5 and use uniform numerical relationships of the reservoir, wells, and pipeline flow equations.
This results in a direct and fully coupled solution of the combined system. The model has a built-in multiphase flow relationship and can handle both steady-state and transient events.
Model overview
Phase density and saturation are defined as cell properties, averaged over the control volume. Flow, on the other hand, is defined at inter-cell junctions and outer boundaries. The three-phase mass balance equations can be written as Equations 1-3 (see equation box).N refers to the number of neighboring junctions and the + and - signs correspond to inlet and outlet junctions, respectively.
From volume conservation, one can write Equation 4.
Equations 1-3 are nonlinear in nature, and can be expanded in terms of pressure and saturation or phase density.
The same equations are adapted for the reservoir, the wells, and the pipeline network. The only difference is that for the latter two, holdup or volume fraction replaces saturation and the porosity factor is one. This common material balance relationship results in a consistent and efficient algorithm.
Flow at junctions is defined by the momentum equation, which in its dynamic form can be written as Equation 5.
For reservoir flow, we use the Darcy equation, Equation 6.
Where phase transmissibility, Ti, is a pressure and saturation dependent term, defined by Equation 7, the Darcy equation (Equation 6) can be shown to be just a simplified form of equation (Equation 5), where the inertia flow term on the left-hand side is neglected.
For well and surface pipeline junctions, Equation 5 is first used to estimate the average flow based on proper friction correlations.6 The distribution of fractional flow for each phase is then estimated based on an inter-phase slip factor which is flow-regime and pressure-dependent and which is defined as the ratio of gas to liquid superficial velocity.
Knowing s, Gasnet estimates the gas and liquid flows with Equations 8 and 9.
Equations 1-9 are cast in the dynamic system form (Equation 10) where represents a vector of the state variables pressure, saturation, and phase flow. The equation system defined in Equation 10 is then linearized to obtain Equation 11. In Equation 11, the superscript n refers to the time-step number.
The Jacobian matrix J is composed of derivatives of the state vectors with respect to those of the neighboring cells.
The parameter u ranges in value from 0 for an explicit representation to 1 for a fully implicit treatment. The equation system defined in Equation 11 can be solved directly by a suitable sparse matrix solver.
Test simulations
Three test cases illustrate the program.In Case 1, flow redistribution is determined for a two-branch network.
This simple test checks the model's capability for tracking network flow dynamics. Flow is fed from an inlet header into two parallel and identical pipeline branches.
The inlet valve to one of the branches is kept closed for 144 min and then instantaneously opened. The test data are listed in Table 1 [102,812 bytes]. Fig. 1a [118,554 bytes] clearly shows the redistribution of flow to an equal level in the two branches following opening of the valve, as should be the case.
The header shows a corresponding reduction in pressure, due to the lower flow resistance in the network. This indicates that the model can properly handle the network flow dynamics.
Case 2 simulates a horizontal gas well. The horizontal well is assumed to be at the center of a three-layered gas reservoir (11 3 9 3 3), with the bottom layer representing the edge of a water aquifer.
This checks whether the model can handle any water cut reaching the well as the water front advances.
Table 1 lists the test data. The bottom hole pressure and water-cut profile is shown in Fig. 1b, following the start of gas production.
At 300 days, the water cut reaching the bottom hole is 10% while at the well tip it is 6%.
The early water front advance towards the well outlet is due to well friction effects and is correctly tracked by the code.
Case 3 couples the pipeline and reservoir. Table 1 lists the test data.
The reservoir is coupled to a pipeline through a five-cluster gas gathering network, with each cluster representing four wells. The gas rate contract assumed at the customer delivery point is 800 MMscfd and the minimum transfer pressure imposed is 1,000 psi.
The pressures at the well head gathering station and the delivery point as well as the gas rate profile are tracked by Gasnet for 10,000 days and plotted in Fig. 1c.
As can be seen, the fixed gas rate can be sustained for about 2,700 days (7.4 years) after which, the delivery rate is predicted to start declining. At that stage, compression would be needed to sustain the fixed contract rate.
The average line pressure drop for this case is about 1.6 psi/mile.
References
- F.A.S.T. Piper, Fekete Associates, 1997.
- Payne, D., "Material_Balnce Calculations in Tight-Gas Reservoirs," Spere, November 1996, p. 260.
- Pipesim, Baker Jardine & Associates, 1997.
- Netopt, Simulation Sciences, 1997.
- Methnani, M., "Dynamic Simulation Model for Oil Reservoirs," SIAM Conference on Mathematical and Computational Issues in the Geosciences, San Antanio, February 1995.
- Beggs, H.D., and Brill J.P., "A Study of Two-Phase Flow in Inclined Pipes, JPT, May 1973, p. 607.
The Author
Mabruk M. Methnani is a senior reservoir simulation engineer at Qatar General Petroleum Corp., Doha, Qatar. He works with reservoir modeling and simulation. Methnani has a PhD in nuclear engineering from the University of Michigan. He is an SPE member.
Copyright 1998 Oil & Gas Journal. All Rights Reserved.

