US olefins industry turns to face global market
Dan Lippe
Petral Consulting Co.
Houston
Like the characters of L. Frank Baum’s Oz series of novels written during the early 1900s, US ethylene producers have had to find their way to the mythical Emerald City by surviving a series of disasters.
After the storms of second-half 2017, US Gulf Coast skies cleared in first-half 2018, with most USGC ethylene producers finding soft landings in second-half 2018. Ethylene producers took the first steps on the journey to the Emerald City in fourth-quarter 2018.
USGC ethylene producers had booked their tour to Emerald City via the Yellow Brick Road several years ago. But now, in 2019-20, they will have to focus on surviving the journey. Trends in polyethylene exports indicate production from new polyethylene plants began to ramp up to full capacity in second-half 2018. The transition of focus from North America to the global market for ethylene, polyethylene, and other ethylene derivatives is well under way.
New plant startups
In second-half 2018, ExxonMobil Chemical Co., Shintech Louisiana LLC, and Indorama Ventures Olefins LLC were scheduled to start up new ethylene plants. ExxonMobil Chemical was the only producer to meet its target, commissioning its new 1.5-million tonne/year ethane steam cracker at Baytown, Tex., in late July (OGJ Online, July 26, 2018). In first-half 2019, Formosa Petrochemical Corp., Indorama, Sasol Ltd., and LACC LLC—a 50-50 joint venture of Lotte Chemical Corp. subsidiary Lotte Chemical USA Corp. and Westlake Chemical Corp.—are scheduled to commission new plants with combined nameplate capacity of 9.1 billion lb/year. Petral Consulting Co. also forecasts Shintech’s new plant will start operations second-half 2019.
While some new plants reach full-capacity in 30-60 days, others require 3-4 months. Since ethylene supply is already at modest surplus levels, production from new plants in Louisiana will increase surpluses in USGC markets in first-half 2019.
Ethylene production
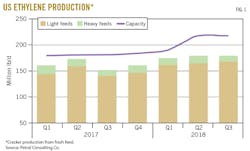
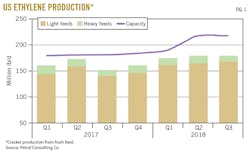
Petral Consulting tracks US ethylene production via a monthly survey of operating rates and feed slates. Results of the monthly survey showed a strong rebound in ethylene production in first-quarter 2018 following the hurricane-depressed production rates of late 2017. Production in first-quarter 2018 increased 14.2 million lb/day (8.4%) from fourth-quarter 2017 before quarterly growth slowed to 4.3 million lb/day (2.4%) in second-quarter 2018. Production during third-quarter 2018 was 179.3 million lb/day, unchanged from the previous quarter. Production, however, increased to 183 million lb/day in fourth-quarter 2018, up 3.7 million lb/day (2.0%) from the third quarter.
Variations in quarterly growth rates for ethylene production paralleled growth in polyethylene exports to destinations other than Canada and Mexico (rest of world, ROW). Exports to ROW destinations in first-quarter 2018 were 4.6 million lb/day (49.8%) more than in fourth-quarter 2017. Growth in polyethylene exports slowed to 0.99 million lb/day (7.2%) in second-quarter 2018 before rebounding to 1.79 million lb/day (12.2%) in the third quarter. The trend in polyethylene exports to ROW destinations in second-half 2018 was a positive leading indicator of the trend in USGC ethylene production rates for 2019 and 2020.
Petral Consulting estimates industry nameplate capacity in operation was 189.1 million lb/day in first-quarter 2018. Production capacity increased to 198 million lb/day in second-quarter 2018 and was 206.5 million lb/day in the fourth quarter.
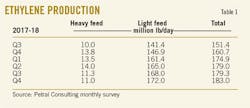
On a regional basis, plants in Texas accounted for all production growth in second-half 2018. Texas plants produced 131.8 million lb/day in the third quarter and 135.8 million lb/day in the fourth quarter. Production from Texas plants in third-quarter 2018 increased 1.4 million lb/day from the second quarter, and fourth-quarter production increased 4 million lb/day (3.1%) more than in the previous quarter. Plants in Louisiana produced 41.3 million lb/day in third-quarter 2018 and 40.7 million lb/day in the fourth quarter (Table 1).
Operating rates dipped to 85.6% in second-quarter 2018 and were 86-90% in second-half 2018. Texas plants operated at 86.3% in third-quarter 2018 and 89.0% in the fourth quarter, while plants in Louisiana operated at 87.5% in the third quarter and 86.2% during the following quarter.
Results of the monthly survey showed some USGC ethylene producers curtailed operating rates in several existing plants during second-half 2018 to limit ethylene oversupply in the Texas Gulf Coast spot market. Petral Consulting estimates ethylene production from Texas and Louisiana plants was reduced by 9-10 million lb/day due to these curtailments, offsetting production from ExxonMobil Chemical’s new 3.3-billion lb/year Baytown plant.
Average operating rates for all ethylene plants mask important variations. In second-half 2018, 17 units (combined nameplate capacity of 34.7 billion lb/year) operated at less than 90% of nameplate capacity, while 20 units (combined nameplate capacity of 40.5 billion lb/year) operated at 90-100%. Of these 20 units, 6 units (combined nameplate capacity of 10.1 billion lb/year) operated at 100% or more of nameplate capacity.
Fig. 1 shows trends in ethylene production.
Ethylene production costs
Ethylene production costs are determined by raw material costs and coproduct credits. Based on variations in yield patterns for the various feeds, coproduct volumes vary widely between the three categories of plants (ethane-only, LPG-only, and multifeed plants). Raw material costs are determined by each feedstock’s price and its conversion to ethylene. Similarly, coproduct credits are determined by spot prices and production volumes for each coproduct but only for those plants that upgrade all coproduct streams to meet purity specifications.
A few ethylene plants can upgrade all coproducts to purity streams and sell all coproducts at market prices. Some ethylene plants produce purity coproduct propylene but produce all other coproducts as mixtures (mixed butylene-butadiene and mixed aromatics) and sell mixtures at discounted prices. Variations in realized revenue for coproducts result in large differences in coproduct credits from one plant to another. Cash production costs are determined by simple addition of raw material costs and coproduct credits (see accompanying box).
Crude oil price trends are always a strong influence on prices for propane, naphtha, gas oil, and most coproducts. Domestic crude oil prices reached their peak in May 2018 and began to decline in June primarily because of constraints in crude pipelines from West Texas to the Texas Gulf Coast. Prices for international benchmark crudes continued to increase in second-quarter 2018 but settled into a plateau during the third quarter. International benchmark prices began to decline in second-half October and continued to fall in November and December. Initially, the decline in second-half October appeared to be a short-lived correction following 15 months of steadily rising prices, but correction became a collapse in November.
The collapse in crude, motor gasoline, and naphtha prices around the world resulted in a sizeable compression in spot prices for heavy feeds vs. light feeds. The crash in crude prices also squeezed ethylene production cost differentials between ethane and all other primary feeds as well as between propane and heavy feeds.
USGC ethylene producers continued to increase ethane’s share of fresh feed in third-quarter 2018, but some ethylene producers responded to the compression in production costs by reducing ethane consumption in fourth-quarter 2018 while continuing to increase ethylene production.
In third-quarter 2018, ethylene produced from ethane was 78% of total production, but ethylene production from ethane fell to 75% in fourth-quarter 2018. At the same time, ethylene produced from propane averaged 11.3% of total production in the third quarter but jumped to 15-16% in the fourth quarter.
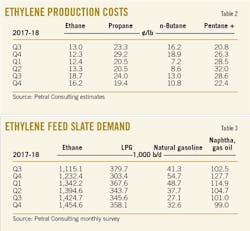
Cash production costs in third-quarter 2018 were 18.7¢/lb for purity ethane, 24.0¢/lb for propane, and 28.6¢/lb for natural gasoline.
Following a series of short-covering episodes in the ethane spot market in Mont Belvieu, Tex., in the third quarter, monthly spot prices for purity ethane declined 10¢/gal both in October and November and by an additional 2.75¢/gal in December. Prices for propane and natural gasoline also declined sharply in fourth-quarter 2018, with cash production costs at 16.2¢/lb for purity ethane, 19.4¢/lb for propane, and 22.4¢/lb for natural gasoline. Propane’s cost advantage to natural gasoline was 3.0¢/lb in the fourth quarter vs. 4.6¢/lb in the third quarter.
Table 2 shows production costs for major ethylene feedstock.
Ethylene pricing, profit margins
Spot prices for ethylene generally fluctuate within a range defined by cash costs for the higher-cost feedstock. The low end of the range is determined by the cash cost for high-cost feedstock with margins in a range of -5¢/lb to +5¢/lb. The high end of the range is determined by cash costs plus margins of 10-15¢lb. Occasionally, a buying void in one or more USGC trading hubs triggers a collapse in spot prices. Second-quarter 2018 was just such a situation, and spot prices continued to be too weak to support positive margins for production from high-cost feeds.
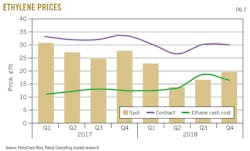
Spot ethylene prices fell sharply in second-quarter 2018. After spot ethylene prices dipped to a low of 13¢/lb in May, a modest rally began in July and extended through September. Spot ethylene’s rising cash cost of production from purity ethane was the key factor that sparked the modest rally. Spot ethylene prices averaged 16.7¢/lb in third-quarter 2018 but varied between 13-20¢/lb, according to PetroChem Wire. Prices were 19.7¢/lb in September, up from 13-14¢/lb in May and June.
A series of short-covering episodes in the Mont Belvieu ethane market pushed purity ethane prices to 60-61¢/gal in mid-September. The bullish impact was enough to support spot prices for purity ethane above 40¢/gal through early October before prices fell to 33-36¢/gal in late October and even weaker in November and December.
Gross margins (spot ethylene prices minus cash production costs) in third-quarter 2018 were -2¢/lb for purity ethane, -7.3¢/lb for propane, and -11¢/lb for natural gasoline. Margins improved in the fourth quarter to 3.5¢/lb for ethane, breakeven for propane, and -2.7¢/lb for natural gasoline. As new plants start up, ethylene supply in the spot market will remain plentiful. Spot prices and gross margins will remain weak for another 4-6 quarters.
Consistent with three full quarters of weak spot prices, PetroChem Wire monthly reports showed the volume of fixed-price trades in Texas and Louisiana fell sharply in second-quarter 2018 and remained weak through yearend. The combined volumes of all fixed-price trades (current month only) for all trading locations were 4.4-4.7 million lb/day in second-half 2018, 35-40% less than the 2015-17 average.
Fixed-price trades at Choctaw Dome, La., accounted for 34% of all fixed-price trades in second-half 2018, according to PetroChem Wire. Trade volumes at Choctaw Dome historically account for 3-6% of fixed-price trades. Leveraging their ownership of ethylene pipelines and weak pricing in the Mont Belvieu spot ethylene market, a few ethylene sellers in Texas took advantage of premium prices for spot trades at Choctaw Dome.
The modest rally in spot ethylene prices in second-half 2018 contributed to an increase in net transaction price (NTP) contract settlements of 7.3¢/lb during third-quarter 2018. NTP settlements averaged 30.1¢/lb in the third quarter, reaching a peak of 33.75¢/lb in September. As purity ethane prices fell from a third-quarter peak of 53¢/gal in September to 29-32¢/gal in November-December, NTP contract settlements fell to 29.25¢/lb for November-December.
Cash production costs based on purity ethane were 15-23¢/lb in second-half 2018, averaging 18.7¢/lb in the third quarter and 16.2¢/lb in the fourth quarter. Cash production costs for propane were 24¢/lb in the third quarter and 19.4¢/lb in the following quarter. Production costs for natural gasoline were 28.6¢/lb in the third quarter before falling to 22.4¢/lb in the fourth quarter.
Gross margins in third-quarter 2018 were 11.4¢/lb for ethane, 6.1¢/lb for propane, and 1.5¢/lb for natural gasoline. Gross margins in the fourth quarter were 13.7¢/lb for ethane, 10.5¢/lb for propane, and 7.5¢/lb for natural gasoline.
Fig. 2 shows historical trends in ethylene spot prices and NTPs.
Olefin-plant feed slate trends
Petral Consulting’s monthly survey of plant operating rates and feed slates showed industry demand for NGL feedstocks jumped to 1.73 million b/d in first-quarter 2018 and 1.74 million b/d in the second quarter. Demand for NGL feeds in first-half 2018 was 209,000 b/d (13.7%) more than in second-half 2017. Full recovery from hurricane-related downtime was the primary factor for the increase in demand in first-quarter 2018. In second-quarter 2018, voluntary plant shutdowns in response to the collapse in spot ethylene prices and production curtailments offset increased production from new capacity (Table 3).
Ethane demand was 1.37 million b/d in first-half 2018, up 195,000 b/d from second-half 2017. Ethane demand increased by 71,000 b/d in second-half 2018 to 1.44 million b/d. Ethane’s share of total fresh feed was 72.9% in first-half 2018 before increasing to 75% second-half 2018. In Texas, ethane’s share of fresh feed was 71.6% in first-half 2018 vs. 67.0% in second-half 2017. In Louisiana, ethane’s share of fresh feed was 70.0% in first-half 2018 vs. 70.5% in second-half 2017.
Propane demand was 267,000 b/d in first-half 2018 and 264,000 b/d in the second half. Propane’s share of fresh feed averaged 14.2% in first-half 2018 and 13.7% in the year’s second half. After first-quarter 2018, demand for heavy feeds varied within a range of 120,000-150,000 b/d, averaging 130,000 b/d in second-half 2018.
Monomer exports
Ethylene and propylene are used as raw material feeds for production of derivative products, with polyethylene and polypropylene as the most important derivatives. US chemical companies focus primarily on selling surplus supplies of polyethylene, ethylene glycol, PVC, polypropylene, and acrylonitrile into international markets. With one ethylene export terminal in operation, however, US suppliers export only small volumes of ethylene monomer.
US International Trade Commission (ITC) data showed ethylene monomer exports averaged 1 million lb/day in third-quarter 2018, down 0.45 million lb/day (30.8%) from second-quarter exports. During 2015-18, monomer exports on a quarterly average basis were within a range of zero to 1.6 million lb/day.
Until a new USGC ethylene export terminal becomes operational, ethylene export volumes will remain just 1-2% of US production and of no practical importance.
Polyethylene exports
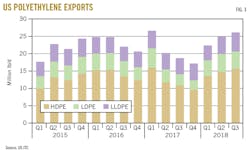
According to US ITC statistics, US exports of polyethylene—including high-density polyethylene (HDPE), low-density polyethylene (LDPE), and linear low-density polyethylene (LLDPE)—rebounded in January-May 2018, continuing to increase during June-October 2018. Exports to all destinations in January-May were 22.9 million lb/day, increasing by 4.9 million lb/day (21.5%) to 27.8 million lb/day in June-October.
Exports to Canada and Mexico in June-October were 10.3 million lb/day, up 0.73 million lb/day (7.7%) from January-May. More importantly, however, exports to all other destinations (ROW) in June-October were 17.8 million lb/day, or 4.4 million lb/day (33.1%) more than in January-May (Fig. 3). If polyethylene exports to ROW destinations increase at a sustained rate of 20% per quarter, Petral Consulting estimates they will reach 40-42 million lb/day by first-half 2020. The ability of US chemical companies to ramp up polyethylene exports at 20%/year every quarter for 6 quarters depends on how many companies decide to play hardball while taking the various turns along the Yellow Brick Road. Increasing exports at 20%/year for 18 months seems like a big hurdle but the ramp up in US exports is about 5%/year based on global polyethylene demand; also, growth rates in global demand are allegedly 4-5%/year. Prices for polyethylene exports will remain under downward pressure for 18-24 months.
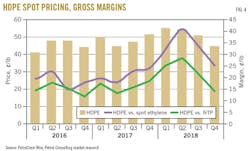
According to PetroChem Wire, spot prices for HDPE (free on board, FOB Houston) were steady at 55¢/lb in first-half 2018. Prices, however, began to decline in the third quarter, falling to 45¢/lb in fourth-quarter 2018. Pricing differentials between HDPE and spot ethylene were 34.5¢/lb in third-quarter 2018 before dipping to 24.9¢/lb in the fourth quarter. Differentials between HDPE and NTP ethylene prices were 21.1¢/lb in the third quarter before slipping to 14.7¢/lb in the fourth quarter. Trends in HDPE-polyethylene differentials show prices for monomer and polymer also were weaker in fourth-quarter 2018.
The strong increase in exports is a harbinger of continued and sustained growth in the polyethylene export market. The increase in exports to ROW destinations, and the increase in polyethylene spot prices are indicators that second-half 2018 and 2019 may be “the best of times” after all (Fig. 4).
Propylene supply
Olefin-plant coproduct supply. Coproduct propylene supply depends primarily on the use of propane, normal butane, naphtha, and other heavy feeds. In first-half 2018, the monthly survey showed demand for LPG feeds (propane and normal butane) was 356,000 b/d, while demand for heavy feeds was 153,000 b/d. In the third quarter, demand for LPG feeds fell to 346,000 b/d, with demand for heavy feeds slipping to 128,000 b/d. Demand for ethane increased in the third quarter but not enough to offset the drop in heavy feed demand. Demand for LPG and heavy feeds, however, increased in the fourth quarter, with LPG feed demand rising to 460,000 b/d (about 105,000 up from the third quarter) and heavy feed demand averaging 132,000 b/d. Demand for ethane was down by about 30,000 b/d.
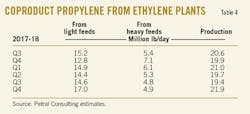
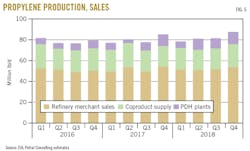
Coproduct supply was 19.3 million lb/day in third-quarter 2018, down 0.4 million lb/day (2.1%) from second-quarter 2018 and 1.3 million lb/day (6.1%) from third-quarter 2017. Coproduct supply jumped to 22.6 million lb/day in fourth-quarter 2018, up 16.8% from the previous quarter.
Coproduct supply from light feeds (ethane, propane, and normal butane) was 14.6 million lb/day in third-quarter 2018 and 17.7 million lb/day in the fourth quarter. Supply from light feeds in the third quarter was 0.6 million lb/day less than third-quarter 2017 but 4.9 million lb/day more than the previous year’s fourth quarter. Coproduct supply from heavy feeds in second-half 2018 was 4.9 million lb/day, down 1.4 million lb/day (22.1%) from second-half 2017 (Table 4).
PDH plant supply. Based on PetroChem Wire’s daily reports and other industry sources, Petral Consulting estimates propylene production from propane dehydrogenation (PDH) plants at the USGC. Three plants with a combined capacity of 13 million lb/day were operational in second-half 2018, with production averaging 11 million lb/day (85% of nameplate capacity).
As of first-quarter 2019, no additional USGC PDH capacity is slated to come on stream for the next 2-3 years. In December 2018, Enterprise Products Partners LP (EPP) announced it has revived plans for a second PDH plant in Mont Belvieu. LyondellBasell Industries NV is also near a final investment decision for a PDH-polypropylene complex. Globally, however, chemical companies continue to expand PDH capacity. Ineos AG, for example, recently announced plans for a major olefins complex at Antwerp, Belgium, that will include a PDH plant (OGJ Online, Jan. 15, 2018).
Refinery supply. Refinery propylene sales into the merchant market are a function of:
• Fluid catalytic cracking unit (FCCU) feed rates (most important variable).
• FCCU operating severity (important but not directly measurable).
• Economic incentive to sell propylene rather than use it as alkylate feed.
Variations in FCCU feed rates generally are the most important parameter determining refinery-grade propylene supply. Economic factors that may result in changes in operating severity are generally of secondary importance.
Statistics from the US Energy Information Administration (EIA) show US refineries operated FCCUs at 5.1 million b/d in third-quarter 2018, up 42,000 b/d (0.8%) from the second quarter. Based on EIA monthly statistics for October 2018 and weekly statistics for November-December, Petral Consulting estimates FCCU feed rates in fourth-quarter 2018 declined by 61,000 b/d to average 5 million b/d.
Regionally, EIA statistics showed feed rates for FCCUs in the USGC and Midcontinent were 3.78 million b/d in third-quarter 2018. Petral Consulting estimates feed rates were 3.74 million b/d in the fourth quarter, with overall second-half 2018 feed rates 69,000 b/d higher vs. first-half 2018.
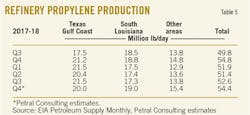
Refinery-grade propylene supply from USGC and Midcontinent refineries was 49.7 mm lb/day in third-quarter 2018 and 49.2 mm lb/day in the fourth quarter. USGC merchant sales—which include all supply from USGC and Midcontinent refineries—in second-half 2018 was up 1 million lb/day (2%) from first-half 2018 (Table 5).
US supply. EIA statistics for refinery-grade propylene and Petral Consulting estimates for coproduct supply and PDH plant production show total USGC propylene supply was 79 million lb/day in third-quarter 2018 and 84 million lb/day in the fourth quarter. Supply from all sources in second-half 2018 was 81 million lb/day, up 4.4 million lb/day (5.7%) from first-half 2018.
Fig. 5 shows trends in coproduct supply, PDH plant production, and refinery merchant sales of propylene.
Propylene economics, pricing
Before any USGC PDH capacity came on stream, Petral Consulting periodically received questions regarding the impact of propylene supply from PDH plants on propylene prices. Based on the operational issues that were generally known in 2010, Petral Consulting’s answer to these questions was consistent: more supply from PDH plants translates into greater pricing volatility for polymer-grade propylene. The same holds true for refinery-grade propylene pricing.
In distinct contrast with persistently weak spot ethylene prices, spot prices for refinery-grade propylene were stronger for most of second-half 2018 based on premiums to unleaded regular gasoline.
At 85% of nameplate capacity, USGC propylene supply from PDH plants will average 11 million lb/day. In the absence of any offsetting reduction in refinery-grade propylene supply, USGC polymer-grade propylene markets should trend toward chronic surplus. The previously anticipated chronic propylene surplus did not occur because US suppliers were able to offset supply growth with increasing monomer exports.
Before 2016, propylene exports were just enough to offset imports from Canada. Exports averaged 0.85 million lb/day in 2010 through first-quarter 2015. During the past 13 quarters (second-half 2015 through third-quarter 2018), however, propylene exports averaged 2.8 million lb/day (about three times more than in 2010 through first-quarter 2015) and were never less than 1.9 million lb/day in the last 9 quarters. In the past 6 quarters, propylene exports were 3.5 million lb/day. Exports are now equal to typical propylene production from one world-scale PDH plant.
Discounts for refinery-grade propylene vs. polymer-grade propylene exceeded 10¢/lb for the first time in second-quarter 2010, but discounts were consistently less than 10¢/lb in fourth-quarter 2010 through third-quarter 2011. During the next 4 years (2012-15), discounts varied within a range of 7-12¢/lb, averaging 10.1¢/lb. Since 2015, discounts for refinery-grade propylene were never less than 10¢/lb in any quarter and averaged 15.7¢/lb in first-half 2018. Discounts were 13.4¢/lb in second-half 2018 and varied within a range of 11-16¢/lb. Discounts for refinery-grade propylene are now routinely 10-12¢/lb and are three to four times more than in 2005-09.
While trends in refinery-grade propylene pricing discounts vs. polymer-grade propylene support a bearish view, trends in refinery-grade propylene prices vs. unleaded regular gasoline prices are bullish. Price premiums for refinery-grade propylene vs. USGC unleaded regular gasoline prices were 5.4¢/lb in second-quarter 2018 before surging to 9-13¢/lb in July-September to average 10.9¢/lb during third-quarter 2018. As the global collapse in motor gasoline prices extended into November-December, however, premiums fell to 6.8¢/lb in November and only 1.7¢/lb in December.
In the current market, unpredictable variations in supply-demand balances result in large swings in polymer-grade propylene pricing and differentials. The unpredictable variability in operating rates of the USGC’s three PDH plants will continue to influence spot prices for polymer-grade and refinery-grade propylene.
Pricing volatility (measured as the standard deviation of day-to-day variation in spot prices for each month) increased as propylene supply from PDH plants and the number of PDH plants in operations increased. In 2017, the standard deviation for day-to-day variation in spot prices averaged 0.62¢/lb and was 1.0¢/lb or more in only 1 month. In first-half 2018, the standard deviation averaged 1.09¢/lb and was 1.0¢/lb or more in 3 months.
All PDH plants settled into a period of sustained and steady operations in fourth-quarter 2018. As anticipated, when PDH plants ran consistently at high operating rates, pricing volatility declined. In third-quarter 2018, standard deviations for daily variations in polymer-grade propylene prices were 0.23-0.73¢/lb, averaging 0.5¢/lb. In the fourth quarter, standard deviations measured 0.5-1.1¢/lb and averaged 0.71¢/lb.
Propylene, polypropylene exports
For the first 3 quarters in 2018, monomer exports varied within a range of 3.0-5.5 million lb/day. Monomer exports in second and third-quarters 2018 were 4.23 million lb/day, up 0.56 mm lb/day (15.1%) from second and third-quarters 2017.
The primary destinations for monomer exports remain Columbia and Mexico. Exports to Mexico were 1.99 million lb/day in first-half 2018, up 0.61 million lb/day (43.9%) from second-half 2017. Exports to Columbia also increased in first-half 2018 vs. second-half 2017, with first-half 2018 exports averaging 1.44 million lb/day, or 0.26 million lb/day (22.1%) more than in second-half 2017. Exports to Mexico slipped to 1.84 million lb/day in July-October 2018. Exports to Columbia were also weaker in July-October, averaging 1.33 million lb/day.
US ITC statistics also show US polypropylene exports were weak in first-half 2018 relative to 2015 through first-half 2017. Polypropylene exports remained weak in second-half 2018 based on July-October statistics. Exports in first-half 2018 were 5.97 million lb/day before falling below 5 million lb/day in September-October. July-October exports averaged 5.11 million lb/day, down 0.87 million lb/day (14.5%) from first-half 2018.
2019 outlook
Domestic chemical companies have taken the first major steps from a period when all important variables within North America were known and developments in markets outside North America were of interest but not generally reason for concern. The future is all about integrating North America into the global marketplace. In 2019, however, producers’ primary focus will be on the new plants in Louisiana and Texas that will start up in 2019.
Petral Consulting forecasts US ethylene production will average 190-210 million lb/day in first-half 2019 and 200-220 million lb/day in second-half 2019. During first-half 2019, production will average 20-25 million lb/day more than in 2018. Year-over-year growth in second-half 2019 will increase 25-30 million lb/day.
The outlook for first-half 2019 has characteristics similar to first-half 2018. Three new plants in Louisiana are scheduled to come on stream in 2019. Indorama’s restart of the 950-million lb/year plant acquired from LyondellBasell is in the early phase of commissioning, while Sasol is likely to begin an extended startup for new ethylene and derivative units at its Lake Charles, La., complex.
After 2019, ethylene producers will have access to additional ethylene export capacity. As one or two export terminals dedicated to ethylene service begin operations in 2020 or 2021, ethylene producers will be able to adjust exports to maintain balanced markets, and a collapse in spot prices similar to first-half 2018 will become less likely.
The author
Daniel L. Lippe ([email protected]) is president of Petral Consulting Co., which he founded in 1988. He has expertise in economic analysis of a broad spectrum of petroleum products including crude oil and refined products, natural gas, natural gas liquids, other ethylene feedstocks, and primary petrochemicals.
Lippe began his professional career in 1974 with Diamond Shamrock Chemical Co., moved into professional consulting in 1979, and has served petroleum, midstream, and petrochemical industry clients since. He holds a BS (1974) in chemical engineering from Texas A&M University and an MBA (1981) from Houston Baptist University. He is an active member of the Gas Processors Suppliers Association.
Feedstock prices, coproduct values, and ethylene plant yields determine ethylene production costs. Petral Consulting maintains direct contact with the olefin industry and tracks historic trends in spot prices for ethylene and propylene. We use a variety of sources to track trends in feedstock prices.
Some ethylene plants have the necessary process units to convert all coproducts to purity streams. Some ethylene plants, however, cannot upgrade mixed or crude streams of various coproducts and sell some or all their coproducts at discounted prices. We evaluate ethylene production costs in this article based on all coproducts valued at spot prices.
