EXTERNAL CORROSION—1 Study investigates damage to cased pipeline segments
New analysis shows pipelines using shorted casings are more susceptible to corrosion than pipelines using nonshorted casings. The preferential location of anomalies on carrier pipe inside casings is 2% of the casing length, or about 3 ft on average from either end of the casing. Beyond 3 ft, peak anomalies are relatively uniformly distributed. The preferential location contains 25% of peak anomalies, or 10 times the likelihood of anomalies elsewhere in the casing.
Operators generally consider cased pipe segments to be safe because time-independent threats, including third-party excavation and outside force damage, are largely eliminated. The possibly enhanced external corrosion of the carrier caused by the casing, however, compromises this safety argument.
No sound evidence exists to suggest that cased segments are safer than uncased ones in terms of leaks per mile or scheduled or immediate responses per mile. A 1984 survey instead revealed that, of 14 countries, five reported corrosion damage on the carrier pipe when casings were used, but none reported corrosion damage on the carrier pipe at crossings where casings were not used.1 External corrosion on the carrier pipe can become more severe than on uncased segments when the carrier pipe has access to electrolyte due to condensation from vent pipes open to air, or in the presence of a short if ground water gains access into the casing-carrier annulus when the casing end seals are either lacking or do not properly seal.
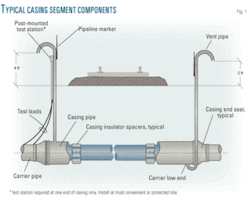
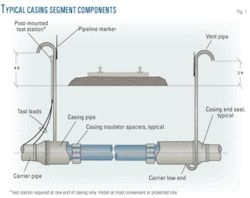
Fig. 1 shows the major elements of a typical casing, including vent pipes, end seals, and insulator spacers.
Background
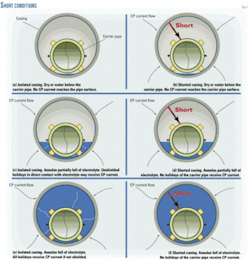
When a thin layer of electrolyte is condensed at the carrier pipe’s coating holidays, a high diffusion rate of oxygen can lead to a high corrosion rate. For such atmospheric corrosion, the absence of continuous conductive electrolyte in the annulus between the casing and the carrier pipe (Figs. 2a and b) can cause external CP to be ineffective in protecting the carrier pipe. Partially filling the annulus with electrolyte (Figs. 2c and d) can still allow atmospheric corrosion at the holidays above the electrolyte-air interface due to the air being humid or possibly saturated by water vapor.
In both cases, if the casing happens to be located near a compressor station, elevated temperature can accelerate the corrosion problem. Elevated temperatures can cause a soft coating on carrier pipe, such as hot applied asphalt, to melt away and therefore turn the cased segment into a bare pipe. The elevated temperatures on the cased segment can create steam in the annulus of the casing, which can cause condensation to form along the top inside of the casing. The condensed water can then drip on the bare line causing it to corrode, followed by formation of a protective oxide.
Continuous dripping of condensed water, however, can create a new cycle of corrosion by washing away the oxide. Such cyclic corrosion can create long lengths of defects along the axis of the carrier pipe, which can result in rupture along this corrosion path. An example of this failure is the 1985 incident of the Texas Eastern Gas Pipeline Co.,2 to be described in the conclusion of this article (OGJ, Apr. 20, 2009).
For the annulus partially filled by electrolyte (Figs. 2c and d), near the interface between the electrolyte and air, a differential oxygen concentration cell can exist. A coating holiday with a short distance below the interface is in an anaerobic environment and serves as the anode. The aerated holidays across and close to the interface serve as the cathode. This oxygen concentration cell is active when CP is shielded by the casing wall, insulator spacers, or made worse by the presence of a metallic short between the casing and the carrier pipe (Fig. 2d).
The metallic short enhances corrosion rate via two paths. First, it removes CP protection as the CP current seeks the lowest electrical resistance path to return to the source, which is through the casing pipe returning to the carrier pipe at the metal-to-metal contact. Second, the short can result in galvanic coupling between the casing wall inner surface and the carrier pipe at the coating holidays. The more positive potential of the casing wall inner surface can shift in the positive direction of the carrier pipe potentials at the coating holidays, resulting in a higher corrosion rate.
A metallic short can develop in several ways, including:3
- Movement or sagging of the carrier pipe in a casing without spacers or with spacers that were incorrectly installed or failed.
- Intentional shorting.
- An accidental short developed between test leads and vent pipes.
CP can offer protection of the carrier pipe holidays immersed in electrolyte in the absence of a metallic short (Figs. 2c and e) and the protection can meet the NACE RP 0169 criteria4 at unshielded holidays with a sufficient polarization to the casing wall outer surface. A metallic short (Figs. 2d and f), however, can fully or partially remove the CP protection depending on the relative resistance of the metallic contact to the annulus electrolyte. The latter resistance depends on factors including:
- Presence or absence of coating(s) on the casing wall.
- Quality of carrier coating.
- Ground water resistivity.
- Annulus space.
- Casing length.
Casings can also obstruct standard methods of direct examination or indirect inspection of the carrier pipe,5 making it more difficult to identify a corrosion problem. Standard procedures for indirect inspections or direct examinations of cased crossings therefore may need modification to address these concerns or new technologies may need to be developed to meet this need.
External corrosion of cased pipe segments is complex and can be influenced by many factors, including:
- Design differences (requirements vary through history).
- Steel or weld type.
- Installation year.
- Historical CP interruptions.
- Historical leaks.
- Historical shorts, short clearance.
- Casing extensions to accommodate road work.
- Bare or coated carrier or casing.
- Coating types, conditions.
- Bacterial presence.
- Local weather conditions.
- Seasonal water table changes.
- Soil electrolyte corrosivity.
- Local air corrosivity related to geographic locations such as coastal or grass-forest lands vs. desert, industrial areas vs. agricultural areas, etc.
- Issues such as stray currents.
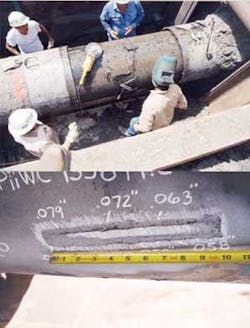
Fig. 3 shows an example of external corrosion of a carrier pipe in a casing due to use of a wooden spacer. The wooden spacer possibly shielded CP, which otherwise would have provided protection. Corrosion under wooden spacers often occurs in older cased segments.
The conclusion of this article (OGJ, Apr. 20, 2009) will focus on:
- Statistical analysis of in-line inspection (ILI) anomaly data provided by seven operators participating in the subject program.
- Evaluation of the effects of metallic shorts vs. nonshort conditions.
- Investigation of historical casing failures.
- Comparison of the number of scheduled or immediate responses/mile for cased vs. noncased segments.
The statistical analysis of ILI anomaly data includes:
- Percentage of cased segments with or without anomalies.
- Anomaly indication distribution vs. distance from either end of a cased segment.
- Casing length distribution.
- Anomaly depth, length, and safety factor distribution.
Data collection, analyses
Table 1 shows a template for collecting ILI data developed by the operators. Recognition that collecting field data was voluntary and could be time-consuming if not focused only on the parameters of this study kept the format simple. Analyses focused on the information contained in the red italicized columns.
• Overall casing statistics. Seven companies contributed their ILI data, with nearly all data obtained from pig runs since 2004. One company provided only data with peak anomaly depths of 20% WT or greater, while other companies provided data for all cased pipe segments including those with no anomalies or with anomalies of any depth.
Table 2 provides a summary of the number of casings studied and the ranges of anomaly depths.
Among the total of 2,733 cased pipe segments, 2,461 either do not have an anomaly or have anomalies with a depth less than 20% WT, accounting for 90% of the population of cased crossings. Under Modified B31G criteria,6 these cased segments require no response action.
Only one cased segment has an anomaly depth exceeding 80% WT, accounting for 0.04% of the total cased pipe segments. If the anomaly is verified by direct examination, B31G criteria7 require the section of pipe containing the anomaly be replaced in order to prevent a leak.
Slightly less than 10% of the total 2,733 cased pipe segments—271 cased segments—contain anomalies with depths between 20% and 80% WT. Modified B31G criteria require a scheduled response or reduction of maximum allowable operating pressure (MAOP).
Table 2 also includes the breakdown for the number of cased pipe segments with anomaly depths between 20% and 80% WT (including 20% WT).
Fig. 4 is a visual demonstration of the casing data in Table 2. The cased pipe segment with an anomaly depth greater than 80% WT is hardly seen (blue color), while the casings with anomaly depths less than 20% WT account for the majority (green color). A significant reduction in the number of the cased pipe segments emerges as anomaly depth increases.
• Data limitations. When reading or interpreting the statistical data, one must keep its limitations in mind. The accuracy of ILI tools in finding and sizing anomalies depends on many factors including, but not limited to:
- Types of pigging tools used; their detection limits.8
- Qualification, competence, and experience of personnel using the tools and interpreting data.
- Software version used to interpret the data.
- Operator ILI procedures, requirements.
• Basis of statistical analyses. Statistical analyses counted and used only the deepest anomaly in a casing (i.e., one anomaly/cased pipe segment) 20% WT or greater in depth. The deepest anomaly represents roughly the most severe corrosion damage anomaly on a cased pipe segment and using it avoids any preferential treatment of pipe segments containing many more anomalies than others.
The deepest anomaly, however, may not always be the most severe because the severity of an anomaly also depends on its length. For multiple casings on one pipe section (with the same carrier pipe diameter, wall thickness, and operating conditions) the failure (burst) pressure (FP) can measure the severity of an anomaly because FP includes the effect of both anomaly length and depth.
But casings on different pipe sections with different carrier pipe diameters or WT, FP alone does not provide a proper basis for comparing anomaly severities. Such circumstances best use the factor of safety (FP/MAOP), which is independent of pipe diameter and WT.
Statistical analyses of a few key variables identified as most useful for this article follow.
• Deepest anomaly distribution based on shortest distance from either end of casing. Fig. 5 shows the number and cumulative percentage of anomalies vs. shortest distance from either end of the casing. A sharp decrease in the number of anomalies (represented by the height of blue columns) appears as the shortest distance increases.
Beyond 60 ft, the number becomes small and sparsely distributed, particularly after 110 ft. The number of anomalies within 60 ft account for 87% (shown on the pink curve). Not shown explicitly, 22% of all the 272 anomalies lie within 2 ft and 25% within 3 ft of either end of the casings.
This absolute shortest distance approach, however, limits determining the distribution of anomalies along cased pipe segments. When the shortest distance is large (˜500 ft), only anomalies on the carrier pipe deep within those long casings (>1,000 ft) can be counted, yielding far fewer anomalies compared to those having a small shortest distance.
Casing length varies from 17.4 ft to 1,584.8 ft in the study used for this article. Using absolute shortest distance therefore masks the true distribution of the anomalies along the length of individual cased pipe segments and overestimates the percentage of anomalies near the ends of cased pipe segments.
Relative shortest distance, defined as the ratio of shortest distance to total casing length, provides a more objective statistical description of how peak anomalies are distributed along the length of individual cased pipe segments.
Fig. 6 shows the first 2% of casing length accounting for roughly 20% of anomalies. Anomalies along the rest of the cased pipe segments are distributed relatively uniformly as demonstrated by the dotted gray line, which passes near most of the pink data points. This distribution shows a preferential distribution of anomalies occurring only near the ends of cased pipe segments.
An average casing length of 136.5 ft yields a preferential distribution distance from either end of cased pipe of: 2% × 136.5 ft = 2.7 ft, roughly consistent with the 25% of anomalies found within 3 ft of either end of cased pipe segments shown in Fig. 5. Although there appears to be a preferential distribution of peak anomalies to the ends of cased pipe segments, however, 75% of the anomalies still lie more than 3 ft from the ends of the casings.
On average, by excavating only 3 ft along each end of casing, an operator would gain roughly 20-25% confidence of locating the peak anomaly within a cased pipe segment. Although this confidence is not as high as desired, the opposite assumption that anomalies are randomly located along the cased pipe segment would require excavation of about 10 times this length to gain the same confidence. The cost and personal safety risk of the extended excavation could be dramatically higher given the typical location of casings under railroads or highways.
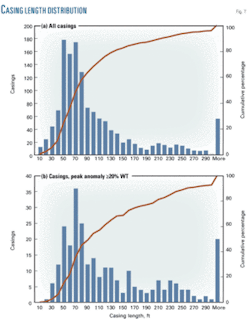
• Casing length distribution. The preceding determination of preferential location of the peak anomaly in a cased pipe segment underlines the importance of understanding the distribution of casing length. Researchers performed a statistical analysis of casing length both for all casings whose lengths were received for the study (Fig. 7a) and for casings containing anomalies with depth =20% WT (Fig. 7b).
Of the 2,733 casings surveyed, a total of 1,357 were analyzed for Fig. 7a. The lengths of the other 1,376 casings were not provided. Of the 1,357 casings analyzed, Fig. 7a shows 73% having a length of 30-120 ft. Average length measured 104.3 ft; median 71.6 ft.
For the 272 cased pipe segments containing peak anomalies with depth =20% WT, casing length varied between 17.4 ft and 1,584.8 ft, with an average of 136.5 ft and median of 93 ft (Fig. 7b). Both the average and median are respectively greater than the 1,357 casings containing no anomaly or containing peak anomalies of any depth, suggesting that longer casing tends to have a higher chance of containing a peak anomaly =20% WT in depth.
• Anomaly distribution based on anomaly depth, length. Fig. 8 shows the number and cumulative percentage of anomalies vs. maximum depth (% WT). The first and second columns from the left represent anomalies with depths of 20% WT and 21% WT, respectively. Peak anomalies less than 20% WT in depth are excluded from this analysis. The average depth measures 27.4% WT, maximum 84% WT, and median 25% WT.
About 52% of the anomalies (pink curve) are within the first 5% span of maximum depth, between 20% and 25% WT, inclusive. The next 5% span (between 25% and 30% WT, including 30%), contains just 23% of anomalies, with >30% WT depth accounting for only 24% of anomalies.
Acknowledgments
Preparation of this article used results of a project sponsored by the Interstate Natural Gas Association of America (INGAA) Foundation and the American Gas Association (AGA).9 The following companies provided ILI data used for this article:
- Dominion Transmission Inc.
- Kinder Morgan.
- Pacific Gas & Electric Co.
- Questar.
- Southern California Gas.
- Spectra Energy.
- Williams Pipeline.
The authors appreciate the assistance of Phil Bennett and Victoria Plotkin of AGA and John Zurcher of Process Performance Improvement Consultants LLC.
Figs. 1 and 2 were modified from a presentation at NACE Corrosion 2006 by Earl Kirkpatrick, ELK Engineering Associates Inc.
References
- Camitz, G., “Cathodic Protection of Natural Gas Pipelines with Casings at Road and Railway Crossings-International Practice and Experience,” NACE Corrosion84, Paper No. 45, New Orleans, Apr. 2-6, 1984.
- US National Transportation Safety Board, “Pipeline Accident Report—Texas Eastern Gas Pipeline Co. Ruptures and Fires at Beaumont, Ky., on Apr. 27, 1985, and Lancaster, Ky., on Feb. 21, 1986,” Report No. NTSB/PAR-87/1, Feb. 18, 1987.
- NACE International, “Steel-Cased Pipeline Practice,” NACE Standard RP 0200-2000.
- NACE International, “Control of External Corrosion on Underground or Submerged Metallic Piping systems,” NACE Standard SP 0200-2007.
- NACE International, “Pipeline External Corrosion Direct Assessment Methodology,” NACE Standard RP 0502-2002.
- Kiefner, J.F., and Vieth, P.H., “A Modified Criterion for Evaluating the Remaining Strength of Corroded Pipe,” PRCI report, Contract: PR-3-805, Catalog No. L51688Be, Dec. 22, 1989.
- ASME, “Manual for Determining the Remaining Strength of Corroded Pipelines, A Supplement to ASME B31 Code for Pressure Piping,” ASME B31G-1991 (Revision of ANSI/ASME B31G-1984), 1991.
- NACE International, “In-Line Inspection of Pipelines,” NACE Standard RP 0102-2002.
- Southwest Research Institute, “Statistical Analysis of External Corrosion Anomaly Data of Cased Pipe Segments,” INGAA Foundation, Report No. F-2007-10, December 2007.
The authors
Fengmei Song ([email protected]) is a senior research engineer at Southwest Research Institute in San Antonio, Tex. He earned his PhD from the University of Toronto in 2002. His research since has focused on solutions to problems that may compromise the integrity of buried oil and gas pipelines. He is a leading researcher in the areas of pipeline internal corrosion, external corrosion, and stress corrosion cracking and their direct assessment methodologies. He is a key member of several committees of the NACE International. He earned his BS and MS degrees from the China University of Petroleum in 1989 and 1992, respectively.
Barron J. Bichon ([email protected]) is a research engineer at Southwest Research Institute in San Antonio. He holds a BS (2002) and MS (2003) from The University of Memphis and the University of Illinois at Urbana-Champaign, respectively. He is a member of the American Institute of Aeronautics and Astronautics (AIAA) and the American Society of Civil Engineers (ASCE).
Bob Fassett ([email protected]) is director of integrity management and technical services for Pacific Gas & Electric Co. (PG&E) in California. He’s been with PG&E for 18 years and has been involved in many aspects of gas distribution and transmission, from engineering to construction. He has a BS in civil engineering from Santa Clara University and has been involved in PG&E’s Integrity Management Program 2003 and is also responsible for the company’s distribution integrity management program. Fassett is chair of NACE TG041 committee on external corrosion direct assessment.
Terry Boss ([email protected]) is senior vice-president of the Interstate Natural Gas Association of America (INGAA). He joined Natural Gas Pipeline Co. of America in 1974, holding positions in field operations, construction, plant and pipeline safety, development engineering, and computer engineering. He joined the Gas Research Institute in 1993 as a principal technology manager in transmission. Boss joined INGAA in September 1995 as director of environment, safety, and operations. In 1996, Boss was promoted to vice-president, environment, safety, and operations and in 2001 to senior vice-president. He is responsible for regulatory policy in pipeline operations, pipeline safety, and environment. Boss received his BS in mechanical engineering from Iowa State in 1974 and his MBA from Illinois Institute of Technology in 1986.
Andrew Lu is director, operations safety, for the American Gas Association. During his time at AGA, he has represented the natural gas industry on several important regulatory initiatives, including pipeline integrity management and distribution integrity management. He currently serves as the staff executive for the safety and occupational health and gas control committees. In addition to his experience at AGA, Lu previously worked for Consumers Energy (1992-96 and 1998-2001) and Mears Group (2006). Lu is a double-graduate from the University of Michigan with a BS in electrical engineering and an MBA.
Correction
In “US LNG imports in 2008 signal unexpected role for gas markets” by Robert Eric Borgstrom and David Anthony Foti (Mar. 9, 2009, p. 56), the vertical axis on Fig. 3 should have read –8% to 12%, not 0% to 12%.
