Can we use dynamic elastic nonlinearity measurements of rocks to map reservoir properties?
Most of the easily extracted oil originating from already discovered fields has been found and produced, while the "difficult" oil has been left behind. The current trend of declining oil production from the producing reservoirs is somewhat self-imposed by the industry, and research efforts related to the new developments of accurate reservoir description for enhanced oil recovery (EOR) from these fields have declined during the last ten years.
At present, lack of accurate subsurface imaging techniques has made the EOR methods costly and inefficient. Recovery of the residual oil using EOR is possible but ultimately depends on the development of new technologies that will enable us to map the geology of the reservoir in greater detail. New technologies are needed to detect the remaining hydrocarbons and accurately map the geologic model of the reservoir to guide strategic and economic recovery from the developed fields.
Reservoir rocks that hold hydrocarbons are elastically nonlinear. This unique reservoir rock property can be effectively used to map the reservoir formations that have hydrocarbon accumulations.
We believe that by using nonlinear seismic imaging methods, new technologies can be developed that will discriminate and illuminate the reservoir rocks and their pore fluids against a background of nonproducing rocks.
Open natural fractures are highly nonlinear and contribute greatly to the fluid-flow mechanisms of a reservoir. The orientation and location of these fractures can be mapped using nonlinear seismic imaging methods.
Nonlinear seismic imaging
In geoscience and seismic exploration, a general assumption is made that the sedimentary reservoir rocks are elastically linear. However, a great deal of evidence based on scientific research done by US national laboratories (Los Alamos, etc.) suggests that the above assumption is not totally valid.
Sedimentary rocks contain an enormous variety of microscopic structural features that consist of different sizes of mineral grains that are bonded and in contact with each other in a totally disordered form.
Most reservoir rocks have intergranular cracks and voids, each with a different elastic property specific to its own composition. So, the elastic properties of the reservoir rocks are related to the stress-strain response of many complex structural features such as fractures, joints, contacts, and grain boundaries.
The complexity is further increased due to the nature of multiphase pore fluids and varying orders of porosity and permeability. The behavior of any one of these composite features is complex and in most cases nonlinear.
In the linear theory of elasticity, two elastic waves propagating simultaneously through a medium do not interact with each other. The equations of motion are linear and the principle of superposition holds.
In an elastically nonlinear medium, the two elastic waves interact with each other. Mixing of the frequencies of the two primary waves takes place; summed and differenced frequencies are generated. In 1963, Westervelt was the first to show that two near-source, colinear (parallel), high-frequency primary waves could interact with each other to produce acoustic waves with frequencies equal to the sum and difference frequencies of the primaries.
This unique property of the elastically nonlinear behavior of the sedimentary reservoir rocks, where new frequencies are generated that were not present in the primary signals, can be effectively used to map in-situ reservoir properties.
Fractured reservoirs
In most of the carbonate and certain sandstone reservoirs, natural fractures are encountered that are open. The fractures control the directional permeability and the effective flow pathways for the hydrocarbons.
Mapping these fractures and their orientation is the key to the economic recovery of hydrocarbons from these reservoirs. At present, natural fracture characterization is of increasing importance, since the industry is venturing into increasing producible reserves from existing fields where production is declining.
Natural fractures in subsurface rocks are usually vertical and are mostly found in the formations that have gone through structural deformation or experienced regional stresses. These fractures commonly terminate at lithologic discontinuities within the reservoir formations.
These fractures can be closely or widely spaced and irregularly distributed. Quite often, swarms of fractures are encountered with unfractured intervals in between. Economic hydrocarbon production from the fractured reservoirs requires optimal access of the wellbore to the open fractures, which makes it extremely important that an accurate map of the open fracture system be available prior to any field infill and development program.
In many cases, fractures are difficult or impossible to map adequately by using currently available technologies. Physical measurements through cores and well logs are limited to the vicinity of the wells drilled in the reservoir. The density of sampling the reservoir rock using cores and well logs quite often is not sufficient to provide any useful information regarding the orientation and the location of the fractures.
Imaging fracture location, orientation
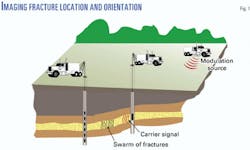
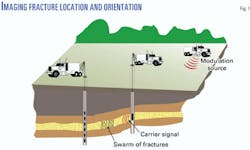
This imaging technique (Fig. 1) uses the measurements of the nonlinearity of the fractured rocks to the seismic waves that are transmitted through them.
Two seismic signals are used. The first is a high-frequency seismic signal ('carrier' wave) transmitted from a wellbore that penetrates the reservoir, travels through the fractured rock, and is recorded by the receivers in another well. The second is a lower-frequency seismic signal ("modulation" wave) that is transmitted from the surface using a movable source like a surface seismic vibrator.
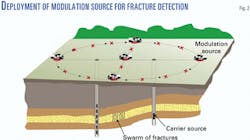
In both cases, sinusoidal seismic signals of preselected frequencies are used. The lower frequency source is placed at predetermined locations on the surface (Fig. 2) to modulate the open subsurface fractures with its compression and rarefaction alternate cycles.
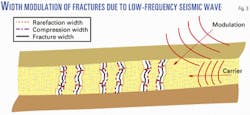
The transmission characteristics of the fractured rock are measured as the fractures tend to close or are squeezed on a compression cycle and open on a rarefaction cycle of the low frequency modulation seismic signal (Fig. 3).
The nonlinearity measurement can be made by analyzing the amplitude and the harmonics of the high-frequency "carrier" wave during compression and rarefaction cycles of the low-frequency "modulation" wave.
During the compression cycle, the stress across the fractures is increased; this tends to partially close the fractures, thus reducing their nonlinearity effect and increasing the amplitude of the 'carrier' wave transmission. During the rarefaction cycle the stress across the fractures is decreased, thus tending to open the fractures and making them more nonlinear and reducing the amplitude of the high-frequency signal.
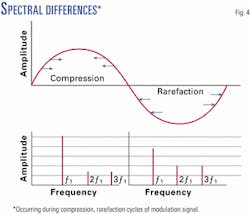
During the compression and rarefaction cycles of the "modulation" wave, the differences in the "carrier" seismic wave caused due to nonlinearity are measured by the relative amplitude of the carrier wave and its harmonics (Fig. 4). This difference is maximum when the surface source that generates the lower-frequency "modulation" wave is located at or near right angles to the open fractures.
The difference, mentioned above, will be zero when the surface source is located parallel to the fractures or directly above them, since the "modulation" signal will have no squeezing effect on the width of the open fractures.
By moving the surface source to different locations on the surface and making measurements on the "carrier" wave, the orientation of the fractures can be determined.
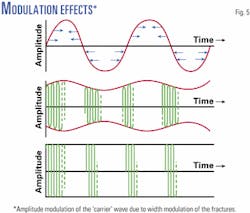
Since practically all subsurface fractures are vertical, the fracture width of the open fractures is not modulated when the surface source is in the same plane as the fractures. The modulation is maximum when the surface source is at or near right angles to the fractures and at a distant offset, so that the "modulation" seismic signal is arriving at the fracture at a wide angle (Fig. 5).
Once the fracture orientation is established, its location can be determined by moving the surface source in a straight line at right angles to the fractures until the differences in the amplitude and the nonlinearity between compression and rarefaction cycles becomes zero. At that point the fractures are located directly below or along the plane of transmission of the surface "modulation" source.
Reservoir porosity imaging
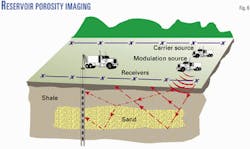
This imaging technique (Fig. 6) uses the measurement of the summed and differenced frequencies that are created due to the interaction of the two seismic (waves) or signals as they propagate through the porous and heterogeneous reservoir rocks.
One of the signals is a vibratory 'sweep' commonly used for seismic recording; the frequency is swept over the seismic band from low to high or high to low over a period of several seconds.
The second signal is a monofrequency sinusoidal signal that has the same time duration as the vibratory sweep.
Both the seismic signals or waves are generated and transmitted using standard vibratory sources from a single source array that behave as a single surface source location.
The combined seismic wave is used for seismic reflection recording. It propagates through the surface formations and is transmitted and reflected at the formation boundaries that provide acoustic impedance contrasts.
The reflected seismic signals are recorded using multiple detector arrays located on the surface or in different wellbores or both. The recording procedures are generally known in the industry.
In this method, the interaction of the two seismic waves as they propagate through the reservoir rocks is measured to map their nonlinear characteristics that are caused due to their bulk porosity, heterogeneity, and fluid contents.
The data, which are recorded, have two different sets of information. The cross-correlation with the standard "sweep" provides the normal dataset that is used for normal reflection processing similar to current 2D and 3D seismic processing that is universally practiced.
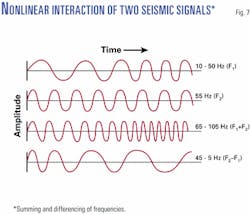
The second set of information is extracted by synthetically generating two new sweep signals. These new signals are generated by adding and differencing the monofrequency with the "sweep" frequencies, thus providing two "modified-sweeps" and cross-correlating the recorded data with these "modified-sweeps" (Fig. 7).
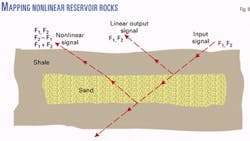
This new set of data, which results after cross-correlation with the two 'modified-sweeps' and contains newly generated frequencies, represents the result of interaction between the monofrequency wave and the "sweep" frequency wave as they propagate through the nonlinear reservoir rocks (Fig. 8).
The processing parameters for this new dataset are similar to the parameters used for the data generated after cross-correlation with the primary "sweep" signal. A conventional 2D and 3D seismic processing sequence can be used for both sets of data to provide the reflection seismic images of the subsurface.
The integration and interpretation of the two results, one based on the primary sweep and the other based on the two "modified-sweeps," highlights and identifies the subsurface formations that are nonlinear due to porosity, microfractures, and fluid saturation.
The results based on the two "modified-sweeps" will display the reflected signals from higher porosity and microfractured formations at relatively higher amplitudes compared to the reflections from homogeneous and nonporous formations. The relative amplitudes of different reflections determine the relative measure of the bulk nonlinearity of the subsurface formations.
The unique contribution of this technique is that it provides a method of differential illumination of the subsurface formations that are of greater interest to the hydrocarbon producers.
Clays and shales are normally less porous, more homogeneous, and behave more linearly in comparison with high porosity sandstones and limestones.
As a result, shales and clays generate a weaker 'interaction' signal and will show a less prominent response on the "nonlinearity seismic section."
The seismic results based on the second dataset that are produced after correlation with the two "modified-sweeps" identify and highlight the zones that have higher nonlinearity due to higher porosity, microfractures, or their fluid content, thus identifying the formations that have greater potential for increasing the hydrocarbon reserves.
Emerging seismic technology
Seismic data provide information from which simple and plausible geologic models can be developed. Quite often, these geologic models are not unique, and there is ambiguity in their interpretation.
To build more confidence in the interpreted results and to derive a more reliable geologic model of the reservoir, new seismic attributes have to be found. At present, when converting seismic to geology, we find that there are more unknowns than the equations to solve them.
A new approach of using nonlinear seismic imaging methods to map the reservoir properties holds a great deal of promise for identifying in-situ reservoir properties like porosity, permeability, fractures, and pore fluids.
Integration of nonlinear seismic with conventional seismic shows the promise and the potential of giving us the tools to economically produce hydrocarbons that have been left behind. Patents have been filed that cover the concepts described in this article.
The authors
Tawassul Khan is president and CEO of Nonlinear Seismic Imaging Inc. with over 40 years of experience in the seismic industry worldwide. After leaving Halliburton Geophysical Services in 1993 he was appointed vice president of marketing and operations for Reservoir Imaging Inc. RII was acquired by Western Atlas International, which then merged in 1997 with Baker Hughes Inc. He has held management positions in operations, research, business development, marketing, and engineering. He has a BA degree in physics and mathematics from Punjab University and a BS degree in engineering from London University.
Sofia McGuire is vice president of Nonlinear Seismic Imaging and is involved with managing the company's business activities. She has been involved independently in financial services since 1986. She holds a BA degree in managerial studies from Rice University and an executive MBA degree from University of Houston. E-mail: [email protected]
