Technique determines average capillary pressure
A new technique estimates the average capillary pressure curve for a reservoir. Data from the Western Desert in Egypt were used to develop the correlations.
Application of the method to four formations shows that, for each formation, the new equations predicted the laboratory-determined capillary pressure of core samples from the same reservoir with errors less than that of the J-function.
Also, the general correlations predicted the laboratory-determined capillary pressures of core samples from three formations with errors less than that of the J-function.
Average capillary pressure
Reservoir studies often require determination of an average capillary pressure, with the Leverett J-function being the most common method to correlate capillary pressure data to porosity and permeability.1
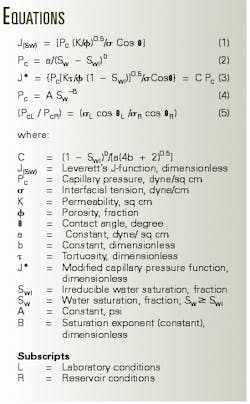
The J-function, Equation 1 (Equation box), was originally proposed as a means of converting all capillary pressure data for clean sand to a universal curve.
While the J-function sometimes correlates capillary pressure data from a specific lithology within the same formation, significant variations can be noted for different formations. Therefore, the J-function may not obtain a universal curve for a shaly sand reservoir.
Amyx's method correlates capillary pressure data to permeability,2 but the method neglects the effect of the porosity.
Pletcher3 used Amyx's plot (semilog plot of permeability vs. water saturation). In his method, at a constant capillary pressure a straight line connects two similar porosities, and a set of straight lines of different porosities plot parallel to the first straight line.
The resulting figure correlates capillary pressure data to porosity and permeability.
El-Khatib showed that Equation 2 represents the capillary pressure curves.4 He used the a and b parameters, as well as the tortuosity and the irreducible water saturation, to develop a modified J-function (Equation 3).
But all three of these methods may fail to determine an average capillary pressure curve for the laboratory-determined capillary pressure curves of core samples from shaly sand reservoirs. In addition, a problem arises when core permeability or porosity does not represent average reservoir properties.
At the same time, capillary pressure curves are usually determined in the laboratory in special core analyses by gas and brine fluids. Under these conditions, the resulting capillary pressure curves are for strong water-wet conditions.
In this study, sets of capillary pressure curves were collected from different formations. The objectives were to develop a new method to determine the average reservoir capillary pressure curve and to develop a general capillary-pressure correlation for all reservoirs studied.
Data
Core samples from the Western Desert in Egypt provided the data for this study.
The data sets are for consolidated shaly-sandstone of mixed wettability. This wettability classification depends on Amott and Amott-Harvey wettability indices, oil- recovery efficiency of water displacement, and characteristics of relative permeability and capillary pressure curves.5
A total of 103 core samples was used. Of these, 58 were analyzed for capillary pressure data, and 45 were used for determining the relative permeability curves. The data are from 11 different formations.
A centrifuge method using oil and water obtained the capillary pressures of Formation 1. For the other formations, the capillary pressures were obtained with a porous-plate method using gas and brine.
Validity of the capillary pressures was checked with the degree of fit (the R2 statistical concept) of Equation 4. This led to the exclusion of one core sample from the analysis.
The general new correlations were based on the analyses of 47 core samples using the porous-plate method and brine-gas system. The validity of the relative permeability analyses was checked by a comparison of the shape of the analyzed curves with the usual shape of the relative permeability curves. Tables 1 and 2 list the data range used to develop the correlations.
Method development
A straight line best fit the points approximating a power relationship when the measured capillary pressure, Pc, and water saturation, Sw, of a sample were plotted on a log-log scale. Mostafa reported similar results.6
The relation between Pc and Sw can be expressed mathematically as Equation 4. This equation indicates that the Constants A and B determine the location and the shape of the capillary pressure curve. The location of a curve with respect to the Pc and Sw axes is defined by the position of its two asymptotes.
The permeability, K, and porosity, f, of the rock-as well as the pore size distribution and wettability of the rock-fluid system-define the location and the shape of a capillary pressure curve. It is then believed that relationships between each of A and B on one hand, and K or K and f on the other hand may be established for a certain reservoir (formation and fluid pairs).
Linear regression analysis techniques determined the Con stants A and B of Equation 4. For each formation, linear regression analysis also determined the relationships between A, and K; and between A, and K and f. Similar relationships for B were also determined for each formation.
These relationships can be used for determining the constants A and B, corresponding to the average reservoir permeability and porosity, and then the average reservoir capillary pressure. The average reservoir porosity is determined from log data.
The average reservoir permeability is determined from a relationship between the effective oil permeability at the irreducible water saturation and the absolute permeability. This relationship is determined from relative permeability data of core f using a linear regression analysis technique.7The effective oil permeability corresponding to the average permeability is determined from transient well test data (drill-stem tests, pressure build-up, etc.).
The resulting average capillary pressure curve is for laboratory, strong water-wet conditions. Data from the laboratory can be converted to reservoir conditions using Equation 5.
Under laboratory conditions, the interfacial tension between the brine and gas, sL, is 71 dynes/cm, and the wetting angle, qL is zero.6 8 The in situ reservoir wetting for water wet conditions is determined by the Holmes method.9Average curve
The following four steps estimate the average reservoir capillary pressure curve with the new method:
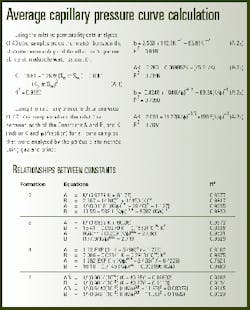
Using the relative permeability data of core samples from the reservoir, develop a relationship between the effective oil permeability at irreducible water saturation and the absolute permeability of the reservoir, similar to Equation A-1 (Sidebar, p. 38).- Use the effective oil permeability (Ko)O-W at Swi from the first transient well test data to estimate a value of the absolute permeability (K) using the developed relation in Step 1.
- Use the estimated values of A and B, the known value of the irreducible water saturation (Swi) from well log data, in Equation 4 to estimate the average capillary pressure curve of the reservoir (formation); Swi less than or equal to Sw less than or equal to 1.0.
- Use Equation A-1 to estimate the permeability of the formation using the effective oil permeability at irreducible water saturation from well test.
- Use the general capillary pressure correlations, Equations A-2a and A-3b, to estimate the values of the Constants A and B.
- Use the estimated values of A and B, the known value of the irreducible water saturation from well log data, in Equation 4 to estimate the average capillary pressure curve of the reservoir, Swi less than or equal to Sw less than or equal to 1.0.
Evaluating the results
The results of the applicability of the four methods to shaly sand formations were compared with that of the developed method and correlations.1-4
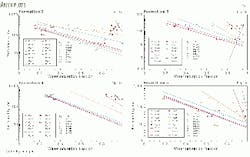
Fig. 1 illustrates four semilog plots of permeability vs. water saturation at constant capillary pressures for core samples from Formations 2, 3, 4, and 5.
The plots indicate that, at any capillary pressure, establishment of a straight-line relationship between the log of permeability and water saturation for the majority of the data has a low degree of fit.
The goodness of fit was determined according to the R2 statistical concept. As R2 approaches 1, this indicates an adequate fit.
The R2 of these straight lines was inserted into Figs. 1a-1d. This low degree of fit implies low accuracy of the estimated average capillary pressure. Therefore, the Amyx technique failed to estimate the average capillary pressure of any of these formations.
Fig. 2a plots the Leverett J-function for the core samples. The figure shows data scattering of the J-function of each formation. The best fit for these formations is a power function with R2 values indicated in Fig. 2a.
Data scattering and low degree of fit refers to low accuracy of the estimated average capillary pressure.
The Pletcher method also was tested. For constant porosity, a curve developed rather than a straight line as proposed by Pletcher. Extrapolating a curve or plotting a parallel may give high uncertainty.
Also, the El-Katib modified capillary pressure J-function (J*) was tested for the capillary pressure data of Formations 2, 3, 4, and 5. The J* scattered data and had a bad fit (Fig. 2b).
Fig. 3 shows the R2 values of this function for these formations.
For each formation, the new capillary pressure correlations predicted measured capillary pressure of core samples from the same formation with lower error than that of the general correlations and J-function.
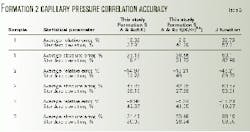
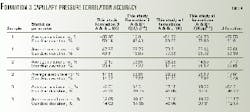
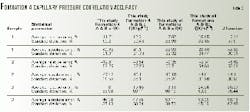
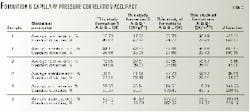
Tables 3-6 compare the statistical accuracy of the new capillary pressure technique with the general correlations and J-function for four formations.
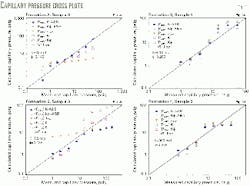
The plots in Fig. 3 crossplot the estimated vs. measured capillary pressures for the correlations, J-function, and general correlations for a core sample from Formation 2, 3, 4, and 5.
Tables 3-6 and Fig. 3 indicate that application of the new technique to a certain formation provided a more accurate average capillary pressure curve than that of J-function.
The new technique needs one to establish a relationships between the constants A and B, and the formation permeability or permeability and porosity.
Once these relationships are established, they can be used to estimate the capillary pressure curves at the positions of other wells in the same formation using the well test and log data from these wells in the absence of special core analysis data.
The general capillary pressure correlations also predicted measured capillary pressure of the core samples used for comparison with accuracy better than that of the J-function.
In addition, well test and log data permits the use of the general capillary pressure correlations in the absence of coring and special core analysis data.
This gives the general capillary pressure correlations the advantage over Amyx and J-function methods, especially in the preliminary evaluation stage where a deficiency of data is predominant.
Acknowledgment
The author thanks the management of Agiba Petroleum Co. for supplying the data used in this study.
References
- Levertt, M.C., "Capillary Behavior in Porous Solids," Trans. AIME, Vol. 142, pp. 152-69, 1941.
- Amyex, J.W., Bass, D.M., and Whiting, R.L., Petroleum Reservoir Engineering, McGraw-Hill, Book Co. Inc., New York City, pp. 158-61, 1960.
- Pletcher, Jeffry L., "A Practical Capillary Pressure Correlation Technique," JPT, July, p. 556, 1994.
- El-Khatib, N., "Development of a Modified Capillary Pressure J-Function," paper SPE 29890 presented at the SPE Middle East Oil Show held in Bahrain, Mar. 11-14, 1995.
- Khairy, M., "An Integrated Approach for Deciding Wettability of Shaly-Sand Reservoirs," proceeding of Al-Azhar Engineering Sixth International Conference held in Cairo, Vol. 8, pp.180-89, Sept. 1-4, 2000.
- Mostafa, K., et al., "Reservoir Characterization Using Well Logs Data: A Qualitative Approch," JPME,2 (2), pp. 77-96, 1999.
- Khairy, M., "Estimating Two-Phase Relative Permeability Using Well Test and Log Data," Journal of Engineering and Applied Science, Vol. 47, No. 4, pp. 739-53, August 2000.
- Slider, H.C., Practical Petroleum Engineering Methods, Petroleum Publishing Co., Tulsa, 1976.
- Holmes, Michel, and Tippie, Douglas B., "Comparison Between Log and Capillary Pressure Data to Estimate Reservoir Wetting," paper SPE 6856, presented at the 52nd Annual Fall Technical Conference and Exhibition of SPE, Denver, Oct. 9-12, 1977.
The author
Mohamed Khairy is an associate professor at King Saud University, Riyadh. He previously was an associate professor at Cairo University and also worked for Agiba Petroleum Co. Khairy has a BS and MS in petroleum engineering from Cairo University and a PhD through a program between Cairo University and Haute Alsace University in France.
