Midyear Forecast: Demand for natural gas, oil continues to show solid gains
Worldwide demand for petroleum products will increase this year in spite of economic slowdowns in key countries. Consumption of natural gas will continue to climb as the price has moderated from its record highs with greater production and larger inventories.
US production of crude will inch up a bit as high prices encourage marginal production, and the call on the Organization for Petroleum Exporting Countries for crude will be lower in the second half of 2001.
US exports will decline, while imports, especially of petroleum products, increase. Refiners continue to operate at high rates to meet demand, but their inventories have been building.
International market
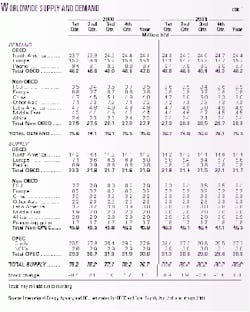
Demand for petroleum products this year is expected to be strong in spite of some weakness in the economies of some key countries. The International Energy Agency lowered its forecast of year 2001 demand growth five times in as many months but still projects an average increase for the first half of 900,000 b/d compared with the first half of last year. For the entire year, demand growth is also forecast at that same figure.
The Paris-based agency reports, "The US, which provided half of the first quarter's demand growth, will continue to be the single largest source of growth for the full year, as European and Asian economies come under pressure." Meanwhile, IEA expects that demand growth in China and the former Soviet Union will be nearly unaffected by the widespread economic slowdown.
First half 2001 demand in the countries of the Organization for Economic Cooperation and Development moved up only slightly, to 47.7 million b/d from 47.3 million b/d a year ago. IEA forecasts that, following a less than stellar third quarter, OECD demand will be especially robust in the fourth quarter and will lift the annual average to 48.2 million b/d.
Non-OECD countries posted an estimated 600,000 b/d first half jump in demand vs. a year ago, but the fourth quarter projection is relatively weak compared with the rebound expected elsewhere. IEA expects FSU demand to be capped by high prices and fuel switching from oil to natural gas, coal, and nuclear power. Also, non-OECD Latin American countries will still feel the effects of the US economic slowdown, and Brazil's electric power supply crisis could cripple that country's growth.
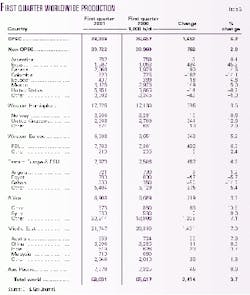
Non-OPEC supply in the first half of this year exceeded that of last year by 500,000 b/d. The only region in this group with an increase of note is the FSU, which has ramped up exports substantially. Output in the FSU averaged 7.75 million b/d in the first half of last year and moved up to an average of 8.35 million b/d in the same period of this year.
OECD supply in the first half of 2001 averaged 21.6 million b/d, down from 22 million b/d in the first 6 months of last year mostly because of lower output from Europe. IEA estimates that OECD output will strengthen a bit in the second half of this year on small production increases in both North America and Europe.
Total non-OPEC supply in the second half of this year is expected be stronger than year-ago levels by 1 million b/d as higher prices have spurred production outside OPEC countries. Inventories of crude were built up in the first and second quarters of this year. When demand surges in the third and fourth quarters of this year, OGJ expects that refiners will draw on these stocks, reducing the need for OPEC oil.
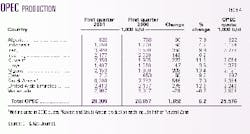
OPEC slashed quotas by 1.5 million b/d effective Feb. 1, bringing its output target to 25.2 million b/d, excluding Iraq. Yet IEA estimates that OPEC crude production, including Iraq, averaged 28.4 million b/d in the first quarter. Total OECD stocks for this quarter grew by 900,000 b/d.
Another quota reduction of 1 million b/d effective Apr. 1 brought the new output target to 24.2 million b/d. OGJ estimates that there was a 1.9 million b/d OECD stockbuild in the second quarter as demand dropped and total OPEC crude production was reduced to 27.6 million b/d. At its July 3 meeting, the organization decided to leave production quotas at their current level.
OGJ projects that with non-OPEC output building, the call on OPEC crude will be 26.8 million b/d in the third quarter, and stocks will diminish by 400,000 b/d. By the fourth quarter, average non-OPEC production is forecast at 47.1 million b/d. If refiners dip into stocks by as much as 1.4 million b/d, then 26.5 million b/d will be required from OPEC to meet demand.
With these OGJ estimates for OPEC production in the second, third, and fourth quarters, the organization's annual output will average 27.3 million b/d of crude, down from last year's average of 27.9 million b/d. The 2001 OECD stockbuild will be 300,000 b/d this year compared with last year's additions to stocks averaging 1.1 million b/d.
Crude oil prices
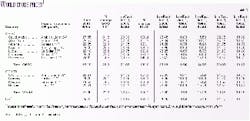
The average world export price of crude oil moderated in the first 6 months from the same period last year, falling to $24.98/bbl from $26.33/bbl.
The monthly average world export price remained strong through November 2000, peaking in September at $31.15/bbl. The December average price was $24.62/bbl.
The world export price moved back up to average $25.81/bbl for February, then slumped to $23.54/bbl in March.
In May, forces combined to put pressure on the crude market: concern over US gasoline supplies; heightened Israeli-Palestinian tensions; OPEC hints that a June quota hike was unlikely; and the threat that Iraqi exports could be halted when the then-current phase of the oil-for-aid program came to an end. The average world export price for May was $26.27/bbl, but for June the average price dipped to $26.01/bbl as supplies were slightly more secure.
On the New York Mercantile Exchange (NYMEX), the near-month futures price for light, sweet crude moved appreciably lower from its recent high of $34.16/bbl that was last November's average. In January, the benchmark averaged $29.31/bbl, inched up to $29.74/bbl for February, then dipped to average $27.36/bbl in March. In April, the price averaged $27.60/bbl, then supply concerns caused the May average to jump up to $28.70/bbl. In June, the price fell back to average $27.73/bbl.
The first 6 months' average for NYMEX crude was $28.41/bbl vs. $28.61/bbl for the first 6 months last year and $15.24/bbl for the first half of 1999.
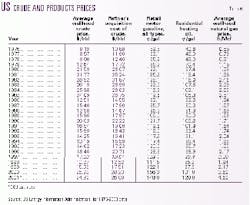
OGJ forecasts that the US wellhead price this year will average $24.90/bbl, down from $26.73/bbl last year, but still much stronger than the 1999 average price of $15.56/bbl and the 1998 average of $10.87/bbl.
Product prices
OGJ's weekly survey of US self-serve unleaded motor gasoline pump prices reveals that the average price for the first half of this year was $1.544/gal, up from $1.465/gal for the same period last year. Excluding all federal, state, and local taxes, the first 6 months' price averaged $1.142/gal this year compared with $1.062/gal last year.
The survey results show that the pump price surged to an average of $1.697/gal in May from an average of $1.571/gal in April and $1.437/gal in March. With June's average coming back down to $1.618/gal, OGJ expects that, barring any unforeseen supply glitches, the price has peaked for 2001, and forecasts that the US pump price for all grades of motor gasoline will average $1.48/gal for the entire year.
Total gasoline taxes at the pump continued a steady climb last year, averaging 41.3¢/gal. Gasoline taxes averaged 37.5¢/gal in 1994, 39.3¢/gal in 1995, 39.6¢/gal in 1996 and 1997, 39.9¢/gal in 1998, and 40.1¢/gal in 1999.
OGJ projects that residential heating oil prices will fall to an annual average of $1.20/gal from last year's record average of $1.31/gal.
Disruptions in the supply chain caused the February 2000 price of home heating oil to average $1.422/gal, excluding taxes. Following several months of more moderate prices, cold weather again drove up the price to $1.41/gal in December. The most recent US Energy Information Administration data show that this year the price has fallen to an average of $1.297/gal for March from $1.344/gal for February and $1.387/gal for January.
Natural gas prices
Though the natural gas market has loosened quite a bit in the past few months from unprecedented levels, average first half 2001 prices were nearly double those in the first half of last year.
US natural gas inventory injections this spring exceeded expectations, driving down prices. Spot gas prices averaged $5.78/MMbtu for the first 6 months of this year vs. $2.90/MMbtu for the same period a year earlier. January's spot price averaged $9.80/
MMbtu this year and just $2.28/MMbtu last year. But the average spot price for March retreated to $4.97/MMbtu, and for June the average fell further to $3.61/MMbtu.
On the NYMEX, the gas futures market at presstime remained in contango for deliveries through next January, although prices have dropped. The average first half 2001 NYMEX near-month futures price for natural gas was $5.41/MMbtu, up from $3.11/MMbtu for the first half of last year.
The NYMEX near-month price last December averaged $8.32/MMbtu, then dipped to $8.12/MMbtu for January before plunging to an average of $5.78/MMbtu in February and $5.19/MMbtu in March. It turned around to $5.23/MMbtu, in April on decreased demand. The May average fell further to $4.32/MMbtu, and the average near-month NYMEX price in June was $3.80/MMbtu.
The average US natural gas wellhead price for 2001 will be $4.60/Mcf, OGJ predicts.
US wellhead prices in 2000 averaged $3.60/Mcf, starting the year at an average of $2.12/Mcf for January and climbing throughout the year to a December average of $6.35/Mcf.
After peaking last January at $8.06/Mcf, the average wellhead price fell to $5.84/Mcf in February and to $5.15/Mcf in March, then inched up to $5.21/Mcf in April.
US economy
The US economy, which grew so quickly early last year, is now nearly stagnant. The boom that saw gross domestic product in first quarter 2000 average 4.8% and then rise to 5.6% in the second quarter began showing signs of weakness a year ago when there was a slight rise in unemployment for the month of May. The Federal Reserve Board had been raising interest rates in order to squelch inflation and keep the economy from growing out of control, and its efforts seemed to work.
For the third quarter last year, GDP growth slowed to 2.2%, then it increased at a pace of only 1% in the fourth quarter. Unemployment remained at 4.0% for each quarter of 2000, but by the Jan. 3 meeting of the Federal Open Market Committee, conditions warranted a cut in interest rates. Citing weakening sales and production, lower consumer confidence, high energy prices, tight conditions in some segments of financial markets, and the fact that inflation pressures had been contained, the Fed implemented the first of six interest rate cuts so far this year.
The most recent interest rate cut was announced June 27, with the FOMC stating that "the patterns evident in recent months-declining profitability and business capital spending, weak expansion of consumption, and slowing growth abroad-continue to weigh on the economy."
OGJ projects that year 2001 GDP will grow 1.5%. First quarter GDP was 1.2%, while unemployment increased to 4.2%. The unemployment rate was 4.5% for April, 4.4% for May, and 4.5% again in June.
Industrial production, sales of new cars and trucks, and housing starts are all expected to decline this year.
US energy demand
Capital spending in the petroleum sector remains strong (OGJ Apr. 9, 2001, p. 66), but the state of the general US economy will help keep demand for energy in check.
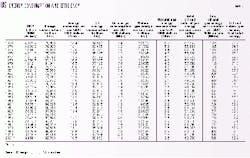
Total US energy consumption is expected to grow at a rate of 1.2% this year, slower than last year's rate of 1.6%. Energy consumption, which has increased every year since 1991, will total 99.7 quadrillion btu (quads) compared with 98.5 quads last year.
Energy consumption efficiency, the amount of energy consumed per dollar of GDP, will improve again this year. This ratio has shown that energy consumption has become more efficient since 1970. Energy consumption efficiency will improve 0.3% this year to 10,540 btu/$1. The ratio was 10,570 btu/$1 last year.
Energy sources
Oil and gas will dominate the US market for energy with a combined share of 62.5%. These two sources met 62.2% of total energy demand last year. The peak in US market share for oil and gas occurred in 1972, when their demand totaled 77.7%.
Oil energy demand will increase 1.3% this year to 38.45 quads. This will give oil a 38.6% share of the market of energy demand, up from 38.5% last year but below the 1999 share of 39.2%. Consumption of oil held steady from 1999 to 2000, with an increase of only 0.01%.
Gas is expected to make the biggest jump among energy sources again this year, gaining 2% over last year's consumption. OGJ projects that demand for gas will be 23.8 quads and comprise 23.9% of the energy market.
Last year gas consumption rose 4.7%, putting a strain on supplies. The residential, commercial, and industrial sectors upped their consumption of gas from the prior year, but electric utilities decreased their use from 1999 by 2%.
Coal's share of total energy demand will decrease while consumption increases 0.8%. OGJ forecasts that consumption of coal will rise to 22.6 quads this year and its market share will be 22.7%, down from 22.8% last year.
Electric utilities used less coal last year than in 1999. But other power producers -nonutility wholesale producers of electricity and nonutility cogeneration plants -more than doubled their use of coal, accounting for almost all of the jump in consumption in 2000.
Demand for nuclear energy is not expected to change much this year. OGJ estimates that nuclear consumption will increase 0.5% to 8.05 quads this year following a 3.5% boost last year when utilization rates were strong. Nuclear power plants in the US operated at their highest rate ever: 88.1% of capacity last year vs. 85.3% a year earlier.
Since July 1998, the number of operable nuclear generating units in the US has remained at 104. The US had its largest number of operable units in 1990 when there were 112.
Nuclear's share of electricity net generation was 19.9% last year, the highest since 1995, when there were 109 operable nuclear generating units that generated 20.1% of electricity in the US.
All other energy demand is satisfied by renewable energy sources. These include hydroelectric; wood, waste, and alcohol; geothermal; and solar and wind. Energy from renewables is expected to increase minimally this year to 6.8 quads and make up 6.8% of the total energy mix.
Last year, consumption of hydroelectric and other sources dropped 6.5%. Demand for renewable energy sources peaked in 1996 at 7.5 quads.
Natural gas market
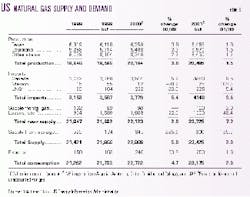
OGJ projects that natural gas demand in the US this year will be 23.175 tcf, an increase from last year of 2%. High prices and lower economic output have suppressed demand so far this year by industrial consumers, while deliveries to residential and commercial users have grown. Moderating prices and increased economic activity are expected to revive gas demand in each of these three sectors by the end of 2001, however.
A colder than normal winter pushed residential demand in January 14% higher than the same month a year earlier. Estimates for March indicate a 30% boost in residential gas demand compared with year-ago figures.
Total consumption of natural gas in the US jumped 4.7% last year, but electric utilities have reduced their use of gas since 1998 by switching to other fuels when both possible and preferable in order to control costs. OGJ expects that gas consumption by electric utilities will continue to decline this year.
The average price of natural gas delivered to utilities swelled to $4.34/Mcf last year from the 1999 average of $2.62/Mcf and 1998's average $2.40/Mcf.
Industrial demand for natural gas is lower from last year by about 2%, according to EIA estimates through May. For all of 2000, though, deliveries of natural gas to industrial consumers exceeded those in 1999 by 6.4%.
Demand for natural gas by commercial consumers through May was up from the same period last year by 10%. This sector took delivery of 9% more natural gas in 2000 than in 1999.
US marketed production of natural gas is forecast to rise 1.5% this year to 20.485 tcf. Last year production increased 3%, and the previous year it sank 0.2%. The peak of natural gas production was 22.648 tcf in 1972, while the recent low occurred in 1986 at 16.859 tcf.
US natural gas imports will gain this year to total 4.14 tcf, a climb of 9.6% over last year's total. Imports of gas via pipeline from Canada are expected to increase to 3.88 tcf compared with 3.544 tcf last year, and pipeline gas imports from Mexico will more than double following a weak year when the US received only 12 bcf from south of the border. OGJ expects that gas imports from Mexico will rebound to 25 bcf this year.
Increased imports of LNG are also expected. Last year the US received 223 bcf of LNG from Algeria, Australia, Qatar, Trinidad and Tobago, and the UAE. This year, LNG imports from these countries are expected to be 235 bcf, a 5.4% increase. In 1999, the US imported 164 bcf of LNG, and in 1998 these imports totaled 86 bcf.
OGJ forecasts that a net 300 bcf of natural gas will be injected into storage this year compared with a net withdrawal of 845 bcf last year. Exports of gas will be 250 bcf, moving up 1.6% this year following a 51% surge a year earlier.
US petroleum demand
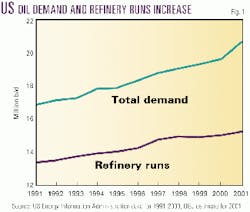
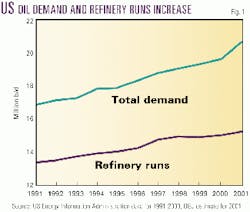
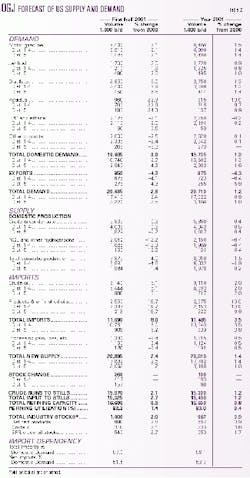
US demand for petroleum products for the first half of 2001 were up 3% from the same period last year, averaging 19.685 million b/d. Products with greater demand were motor gasoline, jet fuel, distillate, and residual fuel oil. Demand for LPG, ethane, and other products declined from the first half of last year.
OGJ projects that for the entire year, 2001 demand for all petroleum products will increase 1.3% from the prior year and total 19.735 million b/d. This will be the 10th consecutive year of increased petroleum product consumption in the US.
Motor gasoline demand
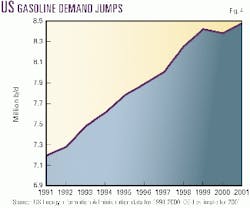
US demand for motor gasoline in the first half of this year was up from a year earlier, averaging 8.4 million b/d vs. 8.2 million b/d.
For the year, motor gasoline demand will be 1.5% greater than in 2000.
US Department of Transportation data show that more miles are being driven. A trend started in the early 1980s that has taken the average number of miles traveled per vehicle, including passenger vehicles, buses, and trucks, from 9,500 to 12,200 in 1998, the latest year for which data are available. At the same time, the number of miles traveled per gallon, the fuel mileage rate, has increased to 17 from 13.3. For passenger cars only, the fuel mileage rate peaked in 1997 at 21.5 and fell in 1998 to 21.4.
Distillate, jet fuel
OGJ forecasts that US distillate demand this year will surpass 2000 consumption by 1.3%.
Colder than normal winter weather increased demand for distillate in the first half of 2001. Distillate demand in the first 6 months of this year averaged 3.85 million b/d compared with 3.6 million b/d during the same period last year. Demand in January exceeded the year-ago level by 14%.
Consumption of home heating oil has taken up the slack caused by a slide in demand for diesel by the trucking industry, which has been adversely affected by the slowdown in the economy.
Demand for jet fuel will increase in 2001 for the 10th consecutive year with a 0.9% hike to 1.72 million b/d. Though economic growth has slowed, consumption data show that it has not curtailed air travel this year.
For the first 6 months of this year, jet fuel demand was 3% greater than for the period a year earlier.
Residual fuel oil
US demand for residual fuel oil will be up 10% this year, OGJ predicts.
Resid demand spiked in the first half of this year as high natural gas prices caused fuel-switching in heavy manufacturing and electric utilities. In fact, demand for resid in the first half of 2001 was up 33% compared with a year earlier. Consumption of residual fuel oil was 1.15 million b/d this January vs. 739,000 b/d in January 2000. Second half demand is expected to moderate as the price of natural gas falls.
Demand for resid peaked in 1977 at 3.1 million b/d and fell each subsequent year until 1998, when sinking oil prices helped it rebound 11% to 887,000 b/d. In 1999, resid demand averaged 830,000 b/d and in 2000, average consumption of resid was 834,000 b/d.
LPG, other products
Demand for LPG and ethane averaged 2.175 million b/d in the first half of 2001, a loss of 2.1% from the same period in 2000. For the year, LPG and ethane demand is projected at 2.25 million b/d, down 0.2% from last year's average.
Increased use of petrochemical feedstocks as a result of general economic growth has helped lift demand for LPG over the past couple of years. LPG demand sank to 1.952 million b/d in 1998 from 2.038 million b/d in 1997, then rebounded in 1999 to 2.195 million b/d. Last year, consumption of LPG totaled 2.185 million b/d.
Demand for all other petroleum products in 2001 is expected to inch up 0.1% to 2.62 million b/d following a first half drop of 2.5% compared with a year earlier. This group of products includes lubes, asphalt, still gas, petroleum coke, and others. These products are in greater demand when there is increased construction and industrial activity, greater highway spending, and more driving.
US petroleum supply
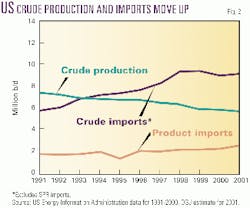
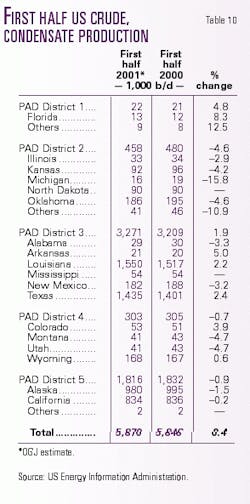
OGJ forecasts that US production of crude and condensate will move up slightly this year, reversing a decade of declines.
Total output of crude and condensate will average 5.86 million b/d, up 0.4%. Production slipped in 2000 to 5.834 million b/d from 5.881 million b/d a year earlier and from 6.252 million b/d in 1998.
Much of the decline in US output is attributed to the drop in Alaskan output, which will continue to fall slightly again this year. Production in the Lower 48, where there are fewer environmental restrictions, is getting a lift from strong crude prices and will account for the small boost in output this year.
Production of crude and condensate in Alaska averaged 970,000 b/d last year compared with 1.05 million b/d in 1999 and 1.175 million b/d the previous year. Alaskan output peaked in 1988 at 2.017 million b/d.
For the first 5 months of this year, Alaskan output averaged 983,000 b/d, down from 1.008 million b/d over the same period last year and 1.11 million b/d in 1999.
US production of natural gas liquids in 2001 is expected to trail last year's level by 6.4%. Production in January was off sharply from a year earlier-1.38 million b/d vs. 1.94 million b/d-as natural gas was selling at a premium to the liquids derived from it. It became more economical to leave NGLs in the gas stream rather than to extract them and sell them to petrochemical plants to be used as feedstocks. In April, NGL production of 1.6 million b/d was the lowest in any month in more than 7 years, according to API.
Total US production of crude, condensate, and NGL will decline by 1.5% this year to 8.01 million b/d.
Imports
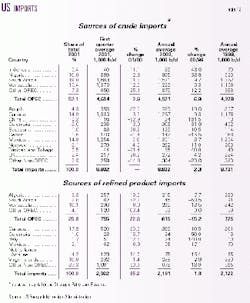
Total US imports of oil will reach an all-time high this year with a 3.5% jump. This will be the sixth consecutive year that imports of crude and products have grown to meet strong US demand.
OGJ forecasts that imports of crude oil, excluding that for the Strategic Petroleum Reserve, will increase 2% to 9.11 million b/d. Year on year, crude imports were up 5.1% for the first 6 months of this year from 2000 but are expected to moderate in the second half of the year.
Saudi Arabia remains the leading source of US crude imports, supplying an average of 1.693 million b/d in the first quarter of this year. Venezuela has surpassed Canada to become the second largest exporter to the US with 1.376 million b/d in the first quarter. Canada, Mexico, and Nigeria round out the top five crude exporters to the US.
After 1994, no crude was imported for the SPR until August 1999; that year and the next imports of crude for the SPR averaged 8,000 b/d. In the first 4 months of this year, SPR crude imports averaged 14,000 b/d.
Product imports are expected to increase 9.9% this year to 2.375 million b/d, following an especially strong first half gain of 19.7% compared with last year.
Last year US imports met 57% of domestic demand, and this year that figure is expected to climb to 58.2% as demand continues to outpace domestic production. With an average of 620,000 b/d, Canada was the largest exporter of products to the US in the first quarter of 2001. Venezuela was second with 296,000 b/d, followed by the US Virgin Islands with 292,000 b/d and Algeria with 258,000 b/d.
During the first quarter of 2001, 45.6% of total US imports came from OPEC, an average of 5.409 million b/d. For the first quarter of last year, OPEC nations accounted for 44.5% of total US imports.
Stocks
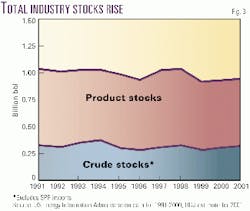
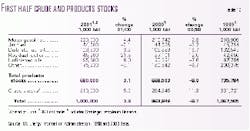
OGJ projects yearend 2001 US oil stocks will total 967 million bbl. Crude oil stocks excluding the SPR are expected to finish the year at 300 million bbl, up from 289 million bbl at yearend 2000. Product stocks will grow to 667 million bbl from 642 million at the end of last year. Heftier stocks are the impetus behind lower crude and product prices that began materializing just before midyear.
At the end of the first half of 2001, total product stocks stood at 690 million bbl, while crude stocks excluding SPR totaled 310 million bbl.
SPR stocks were decreased beginning last October following former President Bill Clinton's order that 30 million bbl of crude be released from the SPR to avert a possible heating oil shortage last winter. SPR stocks ended the year 2000 at 541 million bbl. OGJ projects that at the end of 2001 the SPR will contain 550 million bbl.
Refining
Another year of growing US demand is sustaining the high refining utilization rates of recent years.
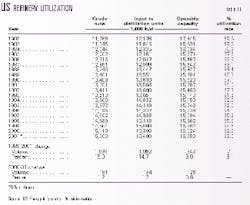
OGJ expects that utilization will average 93% this year, up from the 2000 average rate of 92.6%. Total input will move up 1.2%, while operable capacity increases by 0.8% to 16.65 million b/d this year. For the first 6 months of 2001, the refinery utilization rate was 92.3%.
In 1998, the average refining utilization rate rose to 95.6%, nearly at full sustainable capacity, as some excess is required for maintenance downtime and contingencies.
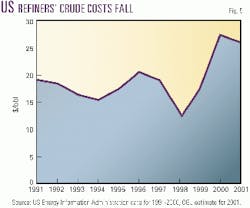
Refiners' acquisition cost of crude surged to $28.23/bbl in 2000 from $17.51/bbl in 1999 and $12.52/bbl in 1998. OGJ projects that the average cost of crude to refiners will fall this year to $26.00/bbl.
Refining margins have fluctuated widely so far this year. IEA figures show that US Gulf Coast cracking margins for WTI in May averaged $2.91/bbl, down from $6.33/bbl in April. The margin averaged $3.29/bbl in March, $1.06/bbl in February, and $4.65/bbl in January.
