Method optimizes Aghajari oil field gas lift
A new approach determined gas-lift valve spacing for an optimized artificial-lift system in the Aghajari oil field in southwestern Iran.
The field produces more than 195,000 bo/d.
The optimization study used pressure-volume-temperature (PVT) data combined with fluid and multiphase flow correlations. A well's gas-lift performance curve was constructed based on actual pressure and temperature surveys and the gas injection point determined from the study.
A nodal method obtained the optimum injection depth, optimum wellhead pressure, optimum producing rate, and minimum injection gas volume.
The study showed that considerable gains in efficiency could be realized by implementing this optimization procedure.
Simulation procedure
The two stages of the Aghajari gas lift simulation included:1
- Calculating the pressure drops in the system.
- Determining the expected production rates for various gas injection rates at different injection points.
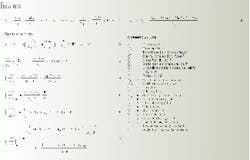
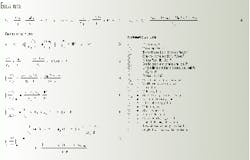
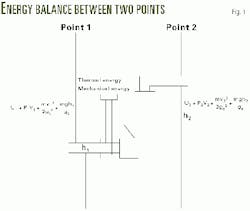
Fig. 1 illustrates the fluid flow and Equations 1 and 2 (see equation box) express the energy balance between two points in the fluid flow.2
For two-phase flow, Equation 2 becomes Equation 3.3
From Equations 4-6, one can calculate the pressure drop in the pipe that is caused by friction, acceleration, and elevation change. Equation 7 expresses the overall pressure drop.
The following lists the correlations used for calculating such fluid properties as solution gas-oil ratio, oil formation volume factor, oil viscosity, gas compressibility factor, and gas viscosity:4-8
- Solution gas oil ratio - Vasquez.
- Oil formation volume factor - Vasquez.
- Oil viscosity - Beggs and Robinson.
- Gas viscosity - Lee, et al.
- Gas compressibility factor - Katz, et al.
Based on these correlations, the study used a computer program for analyzing the production system and determining the vertical multiphase-flow pressure drop in a well.
The correlation for vertical multiphase flow requires knowledge of the well profile, production rates, and bottomhole pressure and temperature. After entering these data into the modeling computer program, one can obtain the pressure as a function of depth.
The program determines the calculated pressure from the pressure traverse and the appropriate multiphase flow correlation.
Optimization procedure
In the calculations, two pressures that always remain fixed and do not vary with the flow rate are the separator pressure and the average reservoir pressure or bottomhole pressure.
The required data needed by the computer program to optimize the gas-lift system are as follow:
- Gas injection temperature, °F. - 110.
- Productivity index, bbl/psi/day - 3.
- Tubing OD, in. - 3.
- Casing ID, in. - 9.625.
- Formation GLR, scf/bbl - 550.
- Gas injection pressure, psi - 1,300.
- Reservoir temperature, °F. - 180.
- Oil gravity, °API - 34.
- Tubing length, ft, - 8,500.
- Water cut, % - 2.
- Separator gas specific gravity - 0.76.
- Tubing ID, in. - 2.625.
- Reservoir pressure, psi - 2,150.
- Oil production rate bo/d - 1,050.
The data include the well profile, production rates, bottomhole flowing pressure, average reservoir pressure at mid-perforation, and surface gas-lift pressure.
The program calculates the production rates as a function of gas injection rates by using the appropriate fluid properties and vertical multiphase-flow correlation. The optimum well performance is the maximum production rate using the minimum amount of injected lift gas.
Well performance depends on production tubing size and injected gas-lift rate. Because the tubing in the well would remain the same, the only parameter left for optimization was the injected gas-lift rate.
The study used the following 12 steps, based on the previously listed data, to determine the gas-liquid ratio (GLR) and gas injection depth to produce at a maximum oil rate:9
- Select the appropriate fluid properties correlations and multiphase flow correlations.
- Calculate the pressure traverse, Pt, inside the tubing string based on the formation GLR.
- Assume a GLR value at different production rates.
- Calculate gas injection pressure, Pg, in the casing-tubing annulus.
- Compare Pt with Pg. The depth of injection is where Pt = Pg - Pvalve.
- Calculate wellhead pressure in the vertical tubing from the assumed GLR and different flow rates.
- Change the GLR value and repeat calculations (Step 2 to Step 6).
- Plot wellhead pressure as a function of flow rate at different GLRs for horizontal pipe and vertical tubing.
- Find the curve intersection points plotted in Step 8.
- Construct the performance curve of production rate as a function of injected gas and determine the optimum production rate and optimum injected gas.
- Determine the gas injection depth at the optimum production rate and optimum injection gas.
- Design the valve installation for the tubing. The valve locations are determined based on the optimum well profile and initial well profile. Brown suggested Equation 8 to find the valve spacing.1
Results
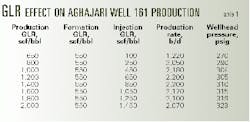
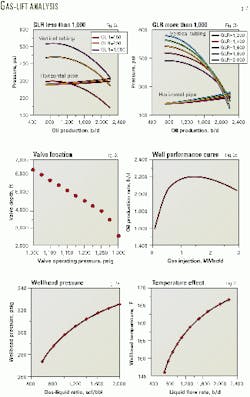
Figs. 2a and 2b show that increasing the GLR from its optimum 1,200 scf/bbl does not improve the producing rate. For example, increasing the GLR to 2000 scf/bbl reduces the production rate to 2,070 b/d from 2,200 b/d (Table 1).
Fig. 2c shows the location of the gas-lift valves.
Equation 8 indicates that gas injection pressure is used for determining the gas-lift valve pressure drop, wellhead pressure changes, and the fluid column after optimizing the gas-lift system.
Fig. 2d illustrates the well performance curve that shows the optimum gas injection volume and optimum production rate. From Fig. 2e, a good estimate of the optimum production rate is 2,200 b/d and optimum injection gas volume is 1.4 MMscfd. The production rate from this study of 2,200 b/d is twice the actual production rate of 1,050 b/d.2
In Fig. 6, the slope of the curve decreases because of an increased pressure drop at high GLRs.
Fig. 2f shows wellhead temperature for different production rates. The increased wellhead temperature is caused by a reduction in fluid residence time in the tubing at a high GLR, and the slope of the curve decreases because of lower production rates.
References
- Brown, K.E., Gas Lift Theory and Practice, Prentice-Hall Inc. Englewood Cliffs, New Jersey, 1967.
- Smith, J.M., and Van Ness, H.C., Introduction to Chemical Engineering Thermodynamics, 4th Edition, McGraw-Hill, 1987.
- Beggs, H.D., and Brill, J.P., "A Study of Two-Phase Flow in Inclined Pipes," JPT, May 1973, pp. 607-17.
- Vasquez. M., and Beggs, H.D., "Correlations for Fluid Physical Prediction," JPT, June 1980, pp. 968-70.
- Beggs, H.D., and Robinson, J.R., "Estimation of the Viscosity of Crude Oil Systems," JPT, September 1975, pp. 1140-41.
- Lee, A.L., Gonzalez, M.H., and Ealin, B.E, "The Viscosity of Natural Gases," JPT, 1966.
- Brill, J.P., and Beggs, H.D., Two Phase Flow in Pipes, University of Oklahoma, 1984.
- Abdel-Wally, A.A., Darwish, T.A., and El-Naggar, M. "Study optimizes gas lift in Gulf of Suez field," OGJ, June 24 1996, pp. 38-44.
- Brown, K.E., The Technology of Artificial Lift Method, Vol. 4, PennWell Publishing Co., Tulsa, 1984.
The authors
Shahaboddin Ayatollahi is an assistant professor of chemical engineering at Shiraz University, Iran. He is currently the head of the Shiraz University computer center and specializes in enhanced oil recovery problems. Ayatollahi has a BS and an MS in chemical engineering from Shiraz University, and a PhD in chemical engineering from the University of Waterloo, Canada.
Alireza Bahadori is a process engineer for the National Iranian South Oil Co. His expertise includes artificial lift. Bahadori has a BS in chemical engineering from Abadan Institute of Technology and an MS in chemical engineering from Shiraz University.
Mahmood Moshfeghian is a professor of chemical engineering at Shiraz University, Iran. He is currently working in the chemical engineering department of the University of Qatar in Doha. Moshfeghian received a BS, an MS, and a PhD in chemical engineering from Oklahoma State University. He is a member of the Iranian academy of sciences, Iranian Petroleum Institute, and Iranian Association of Chemical Engineers.
