Intricate linkages connect natural gas, electricity, heating oil, gasoline
During the past year a series of US energy supply concerns caused extensive unease about the availability and cost of heating oil, the price of gasoline-in what threatened to be a repeat of last year's price spikes-and natural gas price in- creases and supply concerns.
Natural gas prices rose sharply-in certain cases much more than oil. California electricity consumers faced both drastic price increases and "rolling blackouts," with other parts of the country possibly vulnerable as well.
Although crude prices played a role in the higher costs of oil products, lately the cost of crude has averaged about $6/bbl below its November 2000 peak and about the same as a year ago. Thus, other factors besides crude prices must be considered when analyzing product prices.
Intricate linkages contributed to high distillate prices last fall and high gasoline prices this spring. In both cases, natural gas supply problems contributed to the high product prices.
The linkages between natural gas and oil product prices were complex, including the impact that power generators had on oil use and the impact that supplies of oxygenate for gasoline had on gasoline prices. Despite fears, no crisis materialized with respect to either distillate or gasoline.
Market forces encouraged corrective actions that eased first distillate and, lately, gasoline prices. Market forces worked, but the US economic slowdown and deteriorating growth prospects elsewhere contributed.
Both past and prospective energy policies play a major role in determining just how hard market forces have to work to overcome potential supply-demand imbalances.
Natural gas
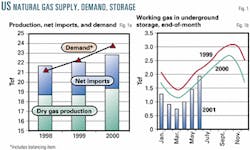
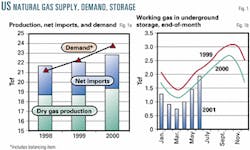
In recent years, US natural gas demand has risen faster than its domestic production and net imports combined (Fig. 1a). During 1998-2000, demand, including the Department of Energy's "balancing item" (which reflects errors in consumption estimates), rose by about 2.5 tcf, while production and net imports rose by only 0.6 tcf each.
Estimates of consumption by all sectors jumped by 1.5 tcf in 1998-2000, but the balancing item grew from near zero in 1998 to about 1 tcf in 2000.
The divergence between demand growth and production and imports supply was filled by storage gas drawdowns. Fig. 1b shows the trends in end-of-month levels of working gas in underground storage from Jan. 1, 1999, through June 2001.
At yearend 2000, gas in underground storage was down by about 800 bcf from its yearend 1999 level and more than 30% below its average yearend level for the decade. For January-March of this year, gas in underground storage averaged about 400 bcf below 2000 levels. However, the gap closed in May.
Preliminary data for the end of June show storage moving above last year's level. This improvement has been supported by supply gains-domestic production is up by 3% so far this year and net imports by 12%-and diminished demand, subdued by the economic slowdown and extraordinarily high prices.
Demand for natural gas, the country's heating fuel of choice, is highly seasonal; peak use comes in the winter months. Gas consumption in January 1999, for example, was 77% higher than consumption in June. In 2000, January consumption was 65% above the June level.
As last year's winter heating season approached, gas demand that exceeded production and imports plus the extraordinarily low levels of stored gas had predictable effects on gas prices nationwide and even more so in particular areas of the country.
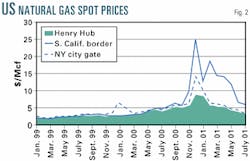
Fig. 2 shows monthly trends in spot prices for gas in three markets. As a rule, the Henry Hub price has been a good proxy for national price trends. This price bounded to $2.42/Mcf in January 2000 and about $5/Mcf in September from $1.85/Mcf in January 1999.
Thereafter, the Henry Hub price spiked to nearly $9/Mcf in December before falling back during winter and spring to its early July level of about $3/Mcf. This past winter, movements in the Henry Hub price did not fully reflect price developments in the Northeast and California.
Two winters ago, gas prices in the Northeast also moved well beyond the Henry Hub price. In January 2000, an unanticipated cold snap strained local gas delivery systems in the Northeast. The New York city gate price that month averaged $6.30/Mcf-almost $4 above the Henry Hub price. However, after January, the New York city gate price moved back toward its more normal differential vs. Henry Hub.
This past winter the differences were even sharper. In December, the average New York city gate price reached nearly $14/Mcf, $5 above the Henry Hub price, but the differential narrowed quickly thereafter. In early July, the New York city gate price was within 30¢/Mcf of the Henry Hub price.
The New York City Gate price spike pales in comparison with the average $25/Mcf Southern California Border price reached in December. This extraordinary increase resulted from the interplay between the rapid growth in gas requirements for electric power generation and limited pipeline capacity.
While the Southern California price has decreased from its peak, it remained in double digits until June, when it fell back to an average of just under $7/Mcf and in early July, to just under $6/Mcf. The Southern California price is still significantly higher than New York city gate or Henry Hub prices.
While the price spikes of late last year followed supply-demand trends, the puzzle is why gas consumption showed such growth, given the significant escalation in gas prices that took place even before the price spikes.
Although the average Henry Hub price for the first 9 months of 2000 was more than 60% higher than for the same period in 1999, gas consumption in 2000 was up 4.7% vs. 1999 (3.9% excluding residential and commercial sector consumption), a higher growth rate than in aNew York year of the 1990s.
Fuel oil
Lags between spot and retail price changes are longer for gas than for oil, so residential gas customers react more slowly to reduce fuel use in tight markets. In addition, while gas prices were moving up through 1999 and especially during 2000, prices of the most relevant competing fuels-fuel oil and distillate-were moving up even faster until late last year.
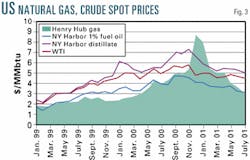
Fig. 3 illustrates this, showing monthly spot price trends for Henry Hub gas, West Texas Intermediate crude, fuel oil, and distillate. Prices for the two oil products are New York Harbor barge prices for 1% sulfur fuel oil (New York fuel oil) and No. 2 oil (New York distillate). For comparability, all prices are stated in terms of dollars per million btu.
In early 1999, the New York fuel oil price was about the same as the Henry Hub gas price, WTI was about 25¢/MMbtu higher, and distillate, about 50¢ higher.
In March 1999, OPEC and other key oil producers agreed to a production cut that underpinned a series of world oil price increases that continued until autumn 2000.
Through May of last year, rising crude prices pulled fuel oil prices significantly above gas prices. Fuel oil prices then generally moved in parity with gas prices until November, when they fell appreciably below, as oil prices dropped and gas prices spiked. Although differentials narrowed, the average fuel oil price remained below the gas price until early July.
Distillate
Distillate costs moved up more than crude oil through late 2000, with both well above gas prices through late 2000. In January 1999, the distillate price was $1.50/bbl-25¢/MMbtu higher than WTI and 53¢/ MMbtu above the gas price.
In January 2000, the differential between crude and New York distillate reached $1.44/MMbtu ($8.60/bbl) and in November, it was $1.85/MMbtu ($11/bbl).
The large differential in January 2000 between Henry Hub gas and New York distillate reflects the same temporary problems of extreme weather in the Northeast with limited near-term ability to meet the local demand surge. Indeed, the price of New York distillate in January was about the same as the price of New York city gate gas-$5.98/MMbtu vs. $6.12/MMbtu. The January New York distillate price exceeded the average Gulf Coast distillate price by 13¢/gal vs. a 2¢ differential the year before.
Last December-January, the New York distillate price was below the Henry Hub gas price. In February-March, they were about the same. Since then, gas at Henry Hub has been clearly cheaper than distillate, while New York City Gate gas prices remained above the average distillate price through April.
Power generation
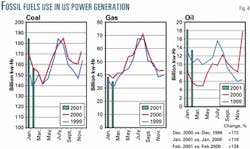
The effects of the price changes show up most dramatically in the sector that makes use of all three fuels, electric power generation. Traditionally, oil's role in power generation has been modest, but extreme increases in gas prices have led to a surge in oil use. Fig. 4 summarizes monthly trends in power generation from the three fuels.
These national figures are propped up by developments in California where severe drought has curtailed hydroelectric power and forced the state to rely on increased supplies of fossil fuel power, almost exclusively gas.
Gas-generated power in California expanded by 35% in 2000, with a December gain of 47% vs. 1999. In January, (the latest month available for state data) gas-generated power in California was up 67% vs. the year earlier.
In the rest of the country, gas generation expanded by only 3%, both for the year as a whole and in December. So far this year, national totals for gas generation are running below year-earlier levels, down 4% in January and 6% in February (Fig. 4).
The monthly pattern for oil-fired generation is very different, however, from gas and distillate. Oil-fired generation in 2000 was well below 1999 levels through much of last year but, beginning in late summer, as prices for gas moved first above fuel oil prices and later distillate, oil use surged.
While for the year as a whole, oil-fired power in 2000 was 12% below its 1999 average, by yearend and early this year, oil-fired power generation was running at more than twice the levels of 12 months earlier. Oil still accounts for a far more modest share of US electric power generation than either coal or gas, but in December-January, the year-on-year increases in billion kilowatt-hours generated from oil were about the same as the increases from coal, and in February, they were far greater. The availability of spare oil-fired capacity and the rapid growth in its use generally helped contain the run-up in gas prices, but in areas such as California, where spare oil-fired capacity was not available, or its use was restricted, local gas prices were less constrained.
Oil, distillate use
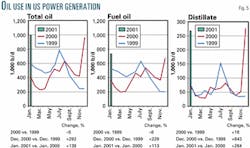
Typically, oil in electric power generation means fuel oil. Although fuel oil use did rise toward yearend 2000, the most dramatic increase in usage, however, was for distillate.
Fig. 5 shows the power generation sector's monthly oil consumption. Fuel oil use surged at yearend, approaching 700,000 b/d vs. only about 200,000 b/d at yearend 1999. This January, fuel oil use reached nearly 750,000 b/d, up almost 400,000 b/d from January 2000.
The gains for distillate, however, were even greater on a percentage basis and unprecedented in terms of volume. In December 2000, distillate use in power generation reached 275,000 b/d, vs. less than 40,000 b/d the year earlier. About the same high level was maintained in January this year vs. the January 2000 level of about 75,000 b/d.
Even California is using more distillate. Gov. Gray Davis eased restrictions on distillate use for power as an emergency measure to improve electric power supply capability. California generators reported using 15,600 b/d of distillate in January, up from less than 1,000 b/d in December 1999. Distillate use accounted for nearly 7% of California's total electric power generation in January, more than 10 times the 0.6% share for wind.
The growth in distillate use for power generation had a significant impact on overall national distillate requirements. In December 2000, power generators accounted for 7% of total apparent distillate demand, up from 1% the year before, and this January, their use accounted for 6% of distillate demand, up from 2% in January 2000. R I N C
Anticipation of higher demand from this sector, as well as from other industrial gas users, plus a low distillate inventory starting point, helped prop up distillate prices well before the start of last winter's heating season.
Nationally, distillate inventories at the end of September 2000, just before the onset of the heating season, were 21% below their year-earlier levels. Distillate stocks were down nearly 50% in the New England and mid-Atlantic states where US heating oil use is most concentrated.
Oil prices
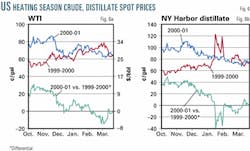
Crude prices were also high at the onset of the 2000-01 heating season despite increased production by the Organization of Petroleum Exporting Countries. While high crude prices led to high product prices, specific concerns about distillate pushed up its price even more. Fig. 6 illustrates trends in spot prices for WTI crude oil and New York distillate for the past 2 heating seasons.
WTI prices during this time are measured in cents per gallon and dollars per barrel. In October-November 2000, crude prices averaged 80¢/gal ($34/bbl). These prices were some 23¢/gal, ($10/bbl) higher than those a year earlier. The gap narrowed, averaging 6¢/gal last January vs. January 2000 and only 1¢/gal for February.
Last March, the crude price fell below the March 2000 price before the differences were dissipated by a new OPEC production cut agreement (Fig. 6a).
In October-November 2000, New York distillate prices were far above those prevailing the year before. The gap, about 40¢/gal, was nearly twice as wide as the gap in crude prices.
In December, the year-on-year gap between New York distillate was still very wide-averaging 30¢/gal-despite a narrowing in the crude price differential to an average 6¢/gal. During the heating season, the spot price of New York distillate drifted downward, both in absolute terms and relative to the price of crude (Fig. 6b).
At the beginning of January, the price of New York distillate was about 20¢/gal above the price of WTI crude. By mid-month, the difference fell and remained at about 10¢.
This pattern contrasts sharply with the year before, when an unanticipated mid-January cold wave had led to curtailments of interruptible gas in the Northeast, a spike in New York city gate gas prices, a surge in demand for the limited supply of immediately available distillate (more than that needed for residential heating), and an immediate near-doubling of spot prices. Those prices dropped in early February, however, when the weather eased and new supplies reached the local market.
Residential heating oil customers had high but relatively stable prices this past heating season as spot market prices started at $1.60/gal, rose to $1.70/gal in December and then fell back to $1.60/gal by early March. Prices through December were significantly higher than the year before, but customers avoided the price surge of mid-January and early February 2000, when residential prices reached $2.12/gal before receding to levels similar to those this year.
No winter crisis
Many feared that much of the country this year would face worse shortages and price hikes than that experienced in mid-January and early February of 2000. It didn't happen-primarily because the markets anticipated the potential crisis, and suppliers responded to market signals in a timely manner. The most obvious sign was the low level of distillate inventories going into the heating season.
In early October 2000, on the East Coast where most heating oil is used, commercial distillate stocks stood at about 40 million bbl-nearly 30 million bbl (42%) below October 1999 levels. In New England, commercial stocks totaled 5.4 million bbl, far below the 15.6 million bbl level of October 1999. These figures exclude the 2 million bbl government-owned Northeast Heating Oil Reserve.
However, in October-December 2000, stocks remained constant and rose only about 10% during January through mid-February-a very different pattern from the previous heating season, when stocks fell sharply by late January before stabilizing in mid-February and March. At the beginning of February this year, stocks were 60% above the crisis levels of the year before.
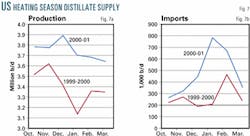
Fig. 7a shows that timely accelerated production-as much as 200,000-550,000 b/d each month-and increased distillate imports prevented the potential crisis this past season. For the heating season as a whole, distillate production averaged about 10%, nearly 350,000 b/d above year-earlier levels.
Imports also were consistently above year-earlier levels (Fig. 7b), especially in the peak winter months, December-February.
Overall, total supplies from US domestic production and imports in December 2000 were 20% above year-earlier levels, while in January and February of this year total supplies were 35% and 14% respectively above year-earlier levels.
Gasoline stocks
As soon as it was apparent there would be no winter fuel crisis, worries intensified about a possible gasoline supply crisis this driving season. To an extent, the actions taken to head off a winter crisis sparked these fears because, in order to meet the extraordinary demand for distillate, yields at refineries were pushed up in December-March by about 2 percentage points. This gain came, in part, at the expense of gasoline. The average refinery yield of gasoline was down by more than 1 percentage point for the period.
The extremely high natural gas prices had an additional negative impact on gasoline supplies apart from the additional shift to distillate, namely a reduced supply of the key gasoline oxygenate and octane booster, methyl tertiary butyl ether.
Natural gas is the feedstock for methanol, from which MTBE is made. Cumulative MTBE production during last December-March was about 5 million bbl below prior-year levels, and absent from gasoline inventories at the beginning of spring.
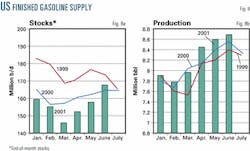
Fig. 8 compares trends in stocks and gasoline production since January 1 with comparable periods in 2000 and 1999. Stocks of finished gasoline early this year fell at the end of March to a low point of 146 million bbl-11 million bbl below the level of March 2000, which itself was exceptionally low (Fig. 8a).
The much higher, end-March 1999 level was in line with the March average for the decade of the 1990s. Since the end of March this year, when sharp increases in production began (Fig. 8b), inventories moved up substantially and were above year-earlier levels by the end of June.
In April, production moved up 500,000 b/d and rose again in May by 140,000 b/d and in June by 110,000 b/d. Overall production in the second quarter exceeded year-earlier levels by 2.5%.
Another potential source of supply, imports, was unchanged from year-earlier levels. Imports are less important as a source of supply for gasoline than they are for distillate. At their peak earlier this year, distillate imports equaled about 20% of domestic production. Finished gasoline imports are averaging about 5% of domestic production.
A temporary flattening of demand in the second quarter also contributed to inventory buildup. As with distillate, gasoline supply concerns early in the peak demand season encouraged corrective actions that as of June led to a more comfortable supply situation-and a decline in prices, leading to a July demand surge (OGJ Online, Aug. 15, 2001).
Gasoline prices
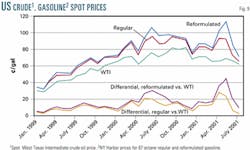
Fig. 9 shows trends in monthly average spot crude and gasoline prices. The crude price is WTI. Two gasoline spot prices are shown-the New York distillate prices for 87 octane gasoline-conventional regular and reformulated.
The lower part of the chart shows the differences between each gasoline price and WTI crude price. Considering the entire period shown, it's clear that the key influence on gasoline prices has been the sharp increase in the price of crude. The price of WTI in summer-fall 2000 was about 50¢/gal above its early 1999 level.
Currently, the crude price is averaging about 10¢/gal below year-earlier levels. The changes in the crude price since early 1999 have been much larger than the normal differentials between crude and gasoline prices. During the entire period shown, the difference between the spot crude price and the spot price of conventional regular gasoline averaged 10¢/gal.
This June, the differential was 6¢/gal, far less than the 36¢/gal difference between the June 2001 average crude price and that of early 1999. However, there have been periods when the differences vs. crude were much wider, especially for reformulated gasoline.
In May-June 2000, the differential between conventional regular gasoline and crude oil reached 20¢/gal. The differentials for reformulated gasoline moved even higher, reaching 27¢ in May and 30¢ in June.
Reformulated gasoline
Last year the introduction of new, more-stringent Phase 2 reformulated gasoline specifications (OGJ Online, June 14, 2001) put upward pressure on gasoline prices, especially for reformulated gasoline, due to initial problems in producing the new product.
Problems were severe in Chicago and Milwaukee markets, where ethanol is used as the blendstock. In June 2000, spot prices of reformulated blendstock for oxygenate blending (RBOB) averaged about 28¢/gal above the average for New York Harbor reformulated. RBOB, the special gasoline blendstock for use with ethanol, accounts for about 90% of the finished gasoline product.
Production problems were aggravated by the Unocal Corp. patent infringement case (OGJ Online, May 9, 2001). Pipeline supply interruptions in the Midwest also contributed to the temporary surge in prices in that region last year. After June 2000, prices of reformulated moved back toward the price of regular and the differentials for both vs. crude narrowed considerably.
This year differentials also surged, and at their peak were higher than last year. In April, the average differential between spot prices for conventional regular gasoline and crude reached 28¢/gal. High levels of unscheduled refinery outages during February-April held potential production back, thereby contributing to this year's early run-up in gasoline prices. The differentials for reformulated gasoline vs. crude moved much higher, reaching an average of 38¢/gal in April and 44¢/gal at their peak in May.
While the exceptionally low end-March level of stocks and lingering problems of producing the new Phase 2 gasoline contributed to this year's price movements, the new factor in the early months of the year was the limited supplies of MTBE, the oxygenate in most of the country's supplies of reformulated gasoline. The latest data indicate that in April-May, MTBE production was running at about year-earlier levels.
Surging gasoline production has brought gasoline prices down substantially both in absolute terms and relative to the price of crude. As of early July, spot prices for conventional regular gasoline were averaging about 30¢/gal below the April average, while crude oil is down about 4¢/gal.
Through May, the production surge did not apply to MTBE, and the spot price of reformulated gasoline continued to climb. Since then, the price of reformulated gasoline has fallen substantially and in early July was only 6¢/gal above the price of conventional regular gasoline.
What's next?
During the past year, early supply scares, accompanied by high prices and then by a market response that eased the situation, were common scenarios for distillate and gasoline. So far, conditions seem to be falling into place for getting off the supply-scare treadmill, at least for the near term.
Natural gas is in much better shape. Although the gains in supply and storage may decelerate with the softening in prices, for now they support a much more relaxed supply starting point for the coming heating season. World oil markets are calm. Even the recent loss of Iraqi oil exports for nearly a month failed to have a visible impact on prices.
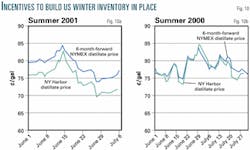
The current markets are also providing incentives to build winter stocks-unlike the situation at this time last year. Fig. 10a shows daily spot prices for New York distillate (dotted line) from June 1 of this year through the latest data available for July. The solid line shows daily NYMEX prices for 6-month-forward distillate-December 2001 and January 2002 delivery contracts.
So far, daily spot prices have been running consistently below the 6-month-forward prices by an average of about 4¢/gal. This pattern of higher prices in the winter, when distillate is most needed, vs. prices today provides an incentive to build and carry stocks into the winter months. Indeed, this price relationship is the one expected under normal market conditions.
The current price relationship is very different from that which prevailed a year ago. As shown in Fig. 10b, in June-July 2000, current prices tended to be the same as 6-month-forward prices. Indeed, occasionally they were higher. This was the period of rising crude prices and near-term supply concerns.
In June-July 2000, markets acquired crude and products to assure near-term needs but gave no support to less immediate concerns such as preparing for the coming winter.
Thus, the return to market normality, and early summer incentives to build distillate stocks improves the odds of a calm market for consumers this coming winter.
Market forces
Markets have worked during the past year. Supply responses to early price signals avoided distillate price surges and reversed them for gasoline. Higher initial prices also helped curb demand, aiding the market-stabilizing process.
Although the California electricity crisis appears to be the exception, it is not. The contributions of regulatory rigidities to that crisis, along with caps on prices to residential customers, are well known.
A key element in the state's response to the crisis has been emergency measures to ease regulatory-induced supply bottlenecks (including electricity from distillate) and to encourage conservation by allowing higher prices to consumers. So far, these actions, along with voluntary conservation measures and the economic slowdown, appear to be containing that crisis.
Energy policy needed
If market forces have done so well, where then-if anywhere-does energy policy fit in?
Markets have had some help, primarily in the slowing US economy and its depressing influence on energy demand. Gross domestic product growth for 2000 averaged a strong 5%. However, in fourth quarter 2000 and first quarter 2001, growth slowed to an average annual rate of only 1%.
There are strong indications from industrial production and unemployment data that the slowdown is still with us. Slower growth in demand eases potential supply bottlenecks and buys time for their removal.
Economic sluggishness is not confined to the US. Growth has slowed in Europe, Japan, and developing countries as well. The worldwide slowdown has curtailed world demand for oil. At the beginning of the year, the International Energy Agency forecast that world demand for oil this year would grow by nearly 2 million b/d. In its latest estimate in June, however, estimated demand growth had been cut to less than 1 million b/d (see story, p. 35).
Lower demand growth, given OPEC's supply decisions, has aided the speedy improvement in crude oil inventories that, in turn, contributed to calmer oil markets this year. Lower demand growth and higher inventories meant less urgency to react to the immediate loss of Iraqi exports. The prompt statements by other OPEC countries, especially Saudi Arabia, that they would raise production to offset disruptive market effects of the Iraqi action was another critical element in dampening any price impact. However, the comfortable inventory position of consumers meant there was no immediate need for offsetting action. They could wait and see what would happen. This kind of market "help" is very expensive in terms of economic well-being.
Policy measures can either help or hinder market adjustments. In the case of gasoline, the existence of so-called "boutique" fuels, or different product specifications in different parts of the country, limits the market's ability to respond to local supply problems.
Oxgenates
An emerging concern is the coming phaseout of MTBE. It is likely that it will not be accompanied by any relaxation of the oxygenate requirement for reformulated gasoline. Current use of MTBE in gasoline is about triple the current use of ethanol, the alternate oxygenate. Unless the situation changes, the need for ethanol as an oxygenate could rise substantially, outpacing US ability to meet the demand, even with imports, and creating risks of sharp new upward price pressures on gasoline (see related story, p. 33).
Ethanol contains about twice the oxygen by weight as MTBE does, so the required volumetric increase in ethanol production would be about one half of the volumetric loss of MTBE. Ethanol is supplied almost entirely from domestic production. A high tariff is levied on ethanol for fuel use, 54¢/gal, with limited exemptions for certain Caribbean Basin sources. About one third of MTBE supplies come from imports.
The timetable for new, extremely low-sulfur levels for distillate could raise future supply problems for that product. In the case of supply, policy is extremely important.
Production increases
Higher prices for gas and oil have definitely stimulated a surge in domestic drilling activity. US gas well completions in 2000 were 45% above the 1999 level, and gas well completions are up 50% now compared with the same period in 2000.
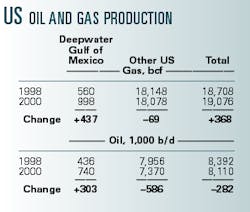
Oil drilling has also increased. Oil well completions rose 14% in 2000 and to date are up an additional 31%. All this drilling, in aggregate, has a disproportionately modest impact on output, however. Gas production was up 2.4% in 2000 and is up about 3% this year so far-important for the current supply-demand balance but very modest compared with the level of increased drilling activity. Oil production this year is still running below levels in the comparable months of 1999 (see table).
Many major US oil and gas producing regions have been intensively explored and developed for many years. This is especially true of the onshore Lower 48 states. Here, advances in technology and the incentives from higher prices are mainly helping to slow production declines and produce more oil and gas from existing resources.
However, there are important exceptions, especially in the deepwater Gulf of Mexico, where technological advances and access to acreage are leading to strong production gains. The table summarizes oil and gas production in 1998 and 2000 in the deepwater Gulf of Mexico and production in the rest of the US.
The near doubling of gas production in the deepwater gulf more than offsets the small decline elsewhere, leading to a net increase for the country as a whole. In 2000, deepwater gulf production accounted for 5% of total US gas production, up from 3% in 1998 and 1% in 1995.
Oil production in the deepwater gulf rose by 70% or 300,000 b/d during 1998-2000, offsetting about half of the production decline elsewhere in the country. Oil production from this source in 2000 accounted for 9% of total US production, up from 5% in 1998 and less than 2% in 1995.
For these gains to occur, the federal government had to make deepwater acreage available
The authors
Ronald B. Gold is a consulting senior adviser to PIRA Energy Group and a consulting vice-president of Petroleum Industry Research Foundation Inc. (PIRINC), New York. He retired from Exxon Corp. at yearend 1997, where he was company economist and manager of the Energy Outlook division for Exxon Co. International. Gold also worked for the US Treasury Department, Office of Tax Analysis and was an assistant professor of economics at Ohio State University. Gold has an undergraduate degree from Brooklyn College, City Univer- sity of New York, and an MA and PhD in economics from Princeton University.
John H. Lichtblau is chairman and CEO of PIRINC. He headed PIRINC as executive director during 1961-90. Lichtblau has served since 1968 on the National Petroleum Council, an industry advisory group appointed by the US Secretary of Energy, and is a member of the Council on Foreign Relations. He also is chairman of PIRA Energy Group, a private consulting firm. A leading international expert on the petroleum industry and petroleum economics, he has authored a number of publications, has been a frequent witness at congressional hearings on energy policy, and a keynote speaker and lecturer at conferences and seminars. Lichtblau performed his undergraduate work at the City College of New York and graduate study at New York University.
Larry Goldstein is president of PIRA Energy Group and is a board member and president of PIRINC. He has been a member of the Petroleum Advisory Committee of the New York Mercan- tile Exchange and a contributor to studies by the National Petroleum Council. He also has served as a board member and treasurer of the Scientists Institute for Public Information.
