Production tomography merges geophysics with reservoir engineering
A unique approach, formulated as a type of waveform inversion, that integrates production data into high-resolution reservoir models with streamline simulators can resolve reservoir heterogeneity utilizing efficient techniques developed for geophysical imaging.
The use of a streamline simulator and an associated time of flight formulation make such an analogy to seismic inversion possible.
We believe that the streamline-based analytic sensitivity computation and the two-step inversion technique discussed in this article brings the industry significantly closer to production data integration into high resolution models on a routine basis.
Although the streamline-based inversion of production data is a relatively new technology, it is already a commercial reality. The method's speed and versatility is likely to make it an integral part of a reservoir engineer's toolbox.
Integrated reservoir characterization
Reservoir characterization is an inherently multidisciplinary exercise. Building high-resolution quantitative descriptions of petroleum reservoirs necessarily requires combining the skills of geoscientists and engineers to integrate the wide variety of data collected during the producing life of a field. Such data can be broadly classified into two categories: static and dynamic.
The static data refer to time invariant information such as cores, well logs, 3D seismic, and geologic interpretation. The dynamic data are directly related to fluid movement within the reservoir and include such information as pressure transient observations, tracer data, multiphase production history, and time-lapse seismic measurements.
Reconciling static and dynamic data from the reservoir has been an important challenge for the industry. A reservoir model derived from static data such as geologic, well log, and seismic data often results in fluid flow predictions that do not match the observed field production history.
It is essential that reservoir models preserve small-scale property variations observed in well logs and core measurements and at the same time reproduce the large-scale structure and continuity observed in seismic data. Furthermore, because the ultimate objective is to build a model to predict future performance, it is imperative that such models adequately match the observed flow behavior in the field.
For this purpose, reservoir models typically need to be conditioned to dynamic data such as transient pressure, tracer response, and multiphase production data.
Conditioning reservoir models to dynamic data requires the solution of an inverse problem. Such inverse modeling, often referred to as automatic history matching, involves systematically altering the reservoir model in order to honor the field production history.
Inverse modeling can be computationally intensive, requiring hundreds or even thousands of fluid flow simulations, depending upon the size of the reservoir model and the field's production history.
This becomes computationally infeasible for fine-scale reservoir models if one uses conventional finite-difference-based reservoir simulators. As a result, until recently field-scale application of inverse modeling has been limited and mostly restricted to fairly modest model sizes of less than 10,000 grid blocks.
With recent developments in reservoir characterization, it is now fairly routine to generate reservoir models consisting of several hundred thousand to millions of grid blocks. But integration of dynamic data into such high-resolution models remains a challenge for industry.
Geophysical tomography is a highly developed discipline that routinely employs inverse methods related to elastic wave propagation to delineate subsurface structures.
One can actually exploit an analogy between a propagating wave front and a propagating fluid front to cast the dynamic data integration into reservoir models in a manner analogous to seismic tomography. This allows one to formalize a common and very efficient integration of production data based on successful developments in geophysical inverse theory.
Specifically, by combining techniques from asymptotic ray theory and streamline-based flow simulation, we have developed practical tools for reconciling high-resolution reservoir models to tracer tests, pressure interference tests, multiphase production history, and time-lapse seismic response.
These developments have opened up the possibility of routine application of inverse methods for field-scale integration of dynamic data into high-resolution reservoir models.
Streamline-based flow simulation
For fluid flow simulation, we use a streamline-based technique that is computationally efficient and is applicable for a wide variety of reservoir conditions.1 Depending upon the situation, streamline models can be 1-1,000 times faster than conventional finite-difference-based flow simulators and is thus, ideally suited for inverse modeling related to dynamic data integration.
Streamline simulators approximate 3D fluid flow calculations by a sum of solutions along 1D particle trajectories that are tangential to the local fluid velocity or streamlines.
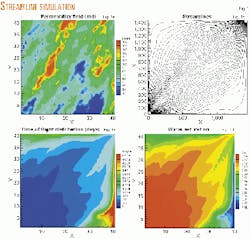
Fig. 1 illustrates the major steps in streamline simulation for a one-quarter of a heterogeneous five-spot pattern (Fig. 1a). The steps include:
- Tracing streamlines based upon a velocity field, typically derived numerically using finite difference or finite element methods (Fig. 1b).
- Computing particle travel time or time of flight along streamlines. The travel time variations capture the effects of geologic heterogeneity on the fluid flow and also provide a quantitative approach to flow visualization (Fig. 1c).
- Decoupling the saturation calculations from geologic heterogeneity by using the time of flight and streamline trajectories to define a new coordinate system. This step reduces the 3D saturation equations to a set of 1D equations with one equation for each streamline.
- Solving for fluid saturation along the streamlines either analytically or numerically (Fig. 1d).
- Occasionally updating the streamlines to account for mobility effects or changing field conditions such as rate changes and infill drilling.
The computational advantage of the streamline approach can be attributed to the fact that streamlines need to be updated only infrequently and the transport equations along streamlines are decoupled from the underlying grid, thus allowing for faster solution.
Furthermore, the self-similarity of the solution along streamlines frequently allows us to compute the solution only once for mapping it to the time of interest.
Streamlines vs. seismic rays
A fundamental basis for the common framework between geophysical imaging and dynamic data integration is the analogy between a propagating fluid front and a propagating wave front.2-5
Fig. 1c shows a contour plot of the streamline time of flight and clearly, the time of flight depicts the fluid front propagation. The front location at any time is given by surfaces of equal time of flight or isochrones.
Streamlines are trajectories that are perpendicular to the fluid front. In seismic tomography, wave fronts are defined by surfaces of equal phase (propagation time) and seismic rays are normals to the wave front. In that sense, a direct analogy exists between streamlines and seismic rays, although there are significant underlying differences as well.
For example, rays can cross in physical space but not in phase space, whereas streamlines do not cross in physical space. It can be shown that high-frequency asymptotic solutions to the governing equations for fluid flow and transport actually mimic the solutions found in wave propagation.3 4 6
Such high-frequency solutions emphasize the rapidly varying spatial and temporal attributes of the solution. This leads to distinct scalar equations for breakthrough or arrival times of the fluid fronts and amplitudes of the associated production response such as water-cut or tracer response.
The history matching or dynamic data integration problem can now be cast in a manner analogous to seismic tomography and waveform imaging. This allows one to use efficient techniques from geophysical imaging for integration of production data into high-resolution reservoir models.3 7
Production tomography
To exploit the analogy between streamline and ray tracing for dynamic data integration into high-resolution reservoir models, we used techniques from the asymptotic ray theory by casting the streamline time of flight equation into the form of an Eikonal equation, the governing equation for travel-time tomography.
The Eikonal equation appears in many contexts such as elastic and electromagnetic wave propagation and its properties are well developed in literature. Streamline-based production data integration can draw upon such similarities to utilize existing methods from geophysical and medical imaging. Briefly, our approach to production data integration with streamlines consist of the following two steps:
1. Analytic computation of sensitivity. Sensitivities quantify change in production response induced by a small deviation in reservoir properties and typically consume a majority of the computation time during inverse modeling. One can exploit the analogy between streamlines and ray tracing to derive analytic expressions for the sensitivity of streamline time of flight to reservoir properties such as porosity and permeability.
The sensitivity computations now involve a single streamline flow simulation and can result in orders of magnitude savings in computation time over conventional numerical methods for sensitivity computation.
2. Two-step inversion. Production data integration is accomplished in the manner of waveform imaging. It involves iterative least-squared matching of the production response starting with a geologic model based on static data. The two-step procedure first matches the first arrival or breakthrough times, and then matches the amplitudes of the production response.
Additional constraints imposed to ensure stability of the solution include a norm penalty that minimizes the deviation from the prior geologic model and a roughness penalty that allows for large-scale changes that are consistent only with the low resolution of the production data.
Tracer test
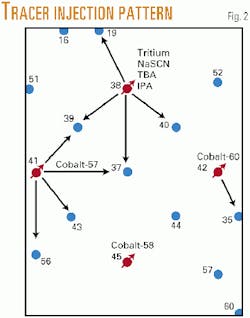
A multiwell, multitracer interwell injection study was carried out in the McCleskey sandstone, Ranger field, Texas. The 320-acre area includes 13 producing and 4 injection wells, injecting seven different tracers. Fig. 2 shows the tracer-injection pattern.
The simulation model included a 31 3 45 3 6 mesh that corresponds to a constant areal grid block dimension of 100 3 100 ft. The vertical grid block dimension varied to account for changes in the formation thickness. Initial permeability distribution was obtained based on static data, primarily cores, well logs, and geologic information.
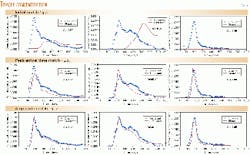
The tracer concentration history for NaSCN (sodium thiocyanate), a conservative tracer, provided the data for improving the permeability distribution in the study area.
Figs. 3a-3c show the initial, peak-arrival time match and amplitude match for the NaSCN data at the sampling wells, and Figs. 4a and 4b show the initial and final permeability distributions. It is clear that the final permeability field has retained the major attributes of the initial permeability model. This is a desirable feature because typically our initial model will be based on static data and any significant deviation from it might render the model geologically implausible.
The permeability change based on the integration of the tracer data (Fig. 4c) maps the difference between the post-inversion and the initial permeability field. These are mostly large-scale changes, consistent with the low resolution of the dynamic data.
We compared our inversion results to the permeability distribution obtained by a manual history matching of the tracer data using a finite-difference simulator.8 In this study, the tracer responses were matched by adjusting permeability/thickness values of individual layers by applying a series of permeability multipliers to a three-layer model.
The study indicated a close agreement between the location and the nature of the permeability multipliers with the location and the shape of areas with higher and lower permeability derived from tracer data inversion. The use of multipliers, however, introduces sharp and potentially geologically unrealistic discontinuities in the permeability distribution.
The proposed dynamic data integration procedure leads to less personal bias compared to manual history matching and also allows for model assessment in terms of resolution and uncertainty of the estimated parameters.3
Most importantly, each inversion run takes only about 10-15 min in a PC to complete compared to several months for a manual history match using a finite difference simulator. This can translate to significant savings in terms of computational and manpower costs.
Interference test
Conoco Inc.'s borehole test facility, Kay County, Okla. (Fig. 5), was the site of an interference tests that illustrates fractured reservoir characterization based on transient pressure measurements.
The tests were conducted in a skewed five-spot pattern. Wells GW-1 through GW-5 penetrate the Fort Riley formation, a fractured limestone formation. The Fort Riley limestone is part of the Lower Permian Chase Group that consists primarily of limestones and shales.
The Fort Riley limestone has about a 1.2 md average permeability. One pressure interference test studied involved groundwater withdrawal at a constant rate of 2.3 l./min from the westernmost well, GW-5. Pressure response was observed in the surrounding wells (Fig. 6).
One advantage of the asymptotic approach adopted in this study is that it allows one to define pressure fronts and arrival times associated with pressure fronts based on the transient pressure response.4 9 Starting with an initial permeability field, the pressure arrival times were matched using the iterative procedure discussed in this article (Figs. 7a-7c). The main feature of the permeability field is a dominant fracture in the east-northeast direction located to the north of Well GW-3.
Independent geophysical experiments verified the location of the fracture with respect to the Well GW-3. Seismic amplitude attenuation indicated a fracture or fracture zone to the north of GW-3 as determined using the transient pressure data.10 Furthermore, a slant well, located slightly to the east of GW-3 verified the location of the fracture zone (Fig. 8).
Water-cut response
The North Robertson (Clearfork) Unit (NRU) is a heterogeneous, low permeability carbonate reservoir in the Permian basin of West Texas. The NRU reservoirs typically are characterized by a high degree of vertical and lateral heterogeneity with low porosity (7.5% limestone matrix), low permeability (0.1-10 md), poor waterflood sweep efficiency. and a low oil recovery factor.
The nonreservoir rock types are relatively impermeable and form vertical barriers contributing to reservoir heterogeneity and compartmentalization. Identification of the location and distribution of these barriers is critical to the success of secondary and tertiary recovery efforts. The fractures also contribute to heterogeneity, further complicating the production response.
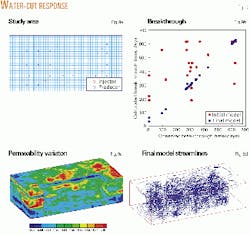
Two sections of NRU, Sections 326 and 327, were selected for a detailed study (Fig. 9a). The reservoir model consists of a 100 3 50 3 12 mesh or a total of 60,000 cells. Altogether data from 42 wells including 27 producing wells and 15 injection wells characterized the heterogeneity based on the water cut response from the producing wells.3 7
An initial reservoir model used geostatistical methods based on well log data from 30 wells.
Fig. 9b compares the water breakthrough response at the producing wells based on the initial model with the field data. Fig. 9b also shows the superimposed calculated and observed breakthrough times at the producing wells after 20 arrival time iterations. Clearly, the breakthrough times are now in complete agreement with the field data.
The computation time for the arrival time matching was less than 2 hr of cpu (central processing unit) time in a workstation.
Fig. 9c displays the permeability variations after incorporating the water breakthrough response. The permeability field derived from this inversion appears consistent with two earlier studies: one based on decline curve analysis and the other based on inversion of water-cut data using a coarser model.
Fig. 9d shows the streamline pattern for the final model.
Time-lapse seismic monitoring
Seismic imaging of reservoir dynamics, known as time-lapse or 4D seismic is a relatively new tool in reservoir monitoring.11-13 Time-lapse monitoring promises to provide high-resolution, three-dimensional images of reservoir processes.
The integration of these data with production observations, such as water cut, constitutes a major advance in reservoir characterization and management. Efficient integration of time-lapse seismic and water-cut data, however, is no trivial undertaking.
The flexibility and speed provided by our production tomography approach will be extremely helpful in this endeavor. While we have no case studies completed at this time, we have examined the utility of a joint inversion of seismic arrival time and water-cut observations.
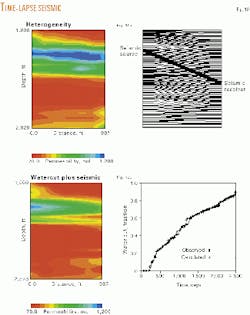
In particular, we have set up a synthetic test case in which seismic arrival times from a crosswell survey are combined with water-cut measurements (Fig. 10a).
In our simulation, we have a high permeability channel extending from the injector to the producer (Fig. 10a, left panel). Because our water-cut data are gathered from the entire producing interval they provide little resolution in the vertical direction. On the other hand, time-lapse seismic observations do constrain vertical and lateral changes in reservoir conditions.
The arrival times are sensitive to changes in saturation and pressure along the ray path between the source and receiver (indicated by the dark black curve in Fig. 10a).
The seismic ray sensitivities coupled with our streamline-based sensitivities relate changes in permeability to changes in saturation and pressure. The permeability sensitivities are constructed from the streamlines, the thin lines in Fig. 10a. Thus, by merging the ray-based seismic sensitivities and the streamline-based sensitivities, one may connect changes in permeability to changes in seismic arrival times.
A high-resolution production tomographic image of reservoir permeability is obtained by combining seismic arrival times and water-cut data (Fig. 10b, left panel).
The imaging approach is extremely fast, utilizing the efficiencies of seismic ray methods with the speed of streamline simulation. Furthermore, in using the seismic and water-cut data jointly, one obtains a more robust solution that, in the end, fits the water-cut values very well (Fig. 10b, right panel).
The integration of seismic and production data is a topic of active research and exciting developments are expected in the not-too-distant future.
Acknowledgments
This article is based on a collaborative research project between the Lawrence Berkeley Laboratory, Texas A&M University, and multiple industry partners. The project has been supported by the Assistant Secretary for Fossil Energy, Office of Natural Gas and Petroleum Technology, through the Natural Gas and Oil Technology Partnership, under US Department of Energy Contract No. DE-AC03-76SF00098.
The authors would like to thank Bob Lemmon from the National Petroleum Technology Office for his continued support and encouragement.
References
- Datta-Gupta, A., "Streamline Simulation: A Technology Update," JPT, December 2000, pp. 68-73.
- Vasco, D.W., and Datta-Gupta, A., "Asymptotic Solutions for Solute Transport: A Formalism for Tracer Tomography," Water Resources Research, Vol. 35, No. 1, 1999, pp. 1-16.
- Vasco, D.W., Yoon, S., and Datta-Gupta, A., "Integrating Dynamic Data into High Resolution Reservoir Models Using Streamline-Based Analytic Sensitivity Coefficients," SPE Journal, Vol. 4, No. 4, December 1999.
- Vasco, D.W., Keers, H., and Karasaki, K., "Estimation of Reservoir Properties Using Transient Pressure Data: An Asymptotic Approach," Water Resources Research, Vol. 36, No. 12, 2000, pp. 3447-65.
- Datta-Gupta, A., Yoon, S., Nordaas, K., and Vasco, D.W., "Streamlines, Ray Tracing and Production Tomography: Generalization to Compressible Flow," Petroleum Geoscience special issue on Geostatistics, May 2001.
- Vasco, D.W., and Datta-Gupta, A., "Asymptotics, Saturation Fronts and High Resolution Reservoir Characterization," Transport in Porous Media, Vol. 42, 2001, pp. 315-50.
- Datta-Gupta, A., Yoon, S., Barman, I., and Vasco, D.W., "Streamline-Based Production Data Integration," JPT, December 1998, pp. 72-76.
- Allison, S.B., Pope, G.A., and Sepehrnoori, K., "Analysis of Field Tracers for Reservoir Description," Journal of Petroleum Science and Engineering, Vol. 5, 1991, pp 173-86.
- Kulkarni, K.N., Datta-Gupta, A., and Vasco, D.W., "A Streamline Approach to Integrating Transient Pressure Data Into High-Resolution Reservoir Models," SPE Paper No. 65120, SPE European Petroleum Conference, Paris, October 2000.
- Majer, E.L., et al., "Utilizing crosswell, single well and pressure transient tests for characterizing fractured gas reservoirs," The Leading Edge, Vol. 15, 1996, pp. 951-56.
- Lumley, D.E., and Behrens, R.A., "Practical issues of 4D seismic reservoir monitoring: What an engineer needs to know," SPE Reservoir Evaluation and Engineering, December 1998, pp. 528-38.
- Sparkman, G., "Introduction: Time lapse or time elapse, "The Leading Edge, Vol. 17, 1998, p. 1386.
- Huang, X., Will, R., Khan, M., and Stanley, L, "Integration of time-lapse seismic and production data in a Gulf of Mexico gas field," The Leading Edge, Vol. 20, 2001, pp. 278-89.
The authors
Akhil Datta-Gupta is an associate professor of petroleum engineering at Texas A&M University, College Station, Tex. He previously worked with BP Exploration-Research and the Lawrence Berkeley National Laboratory. His research interests include reservoir characterization, simulation, and environmental remediation. Datta-Gupta has a PhD in petroleum engineering from the University of Texas at Austin. He is an SPE member.
Don Vasco is a staff scientist at the Berkeley Laboratory at the University of California at Berkeley, where he develops and implements algorithms for seismic and hydrologic inversion. His current research interests are inverse theory, global earth structure, and asymptotic methods for imaging. Vasco holds a BS in geophysics from the University of Texas at Austin and a PhD from the University of California, Berkeley.
