Overburden, fracture pressure, permeability regulate in situ pore-pressure profiles
The petroleum industry must predict pore-pressure profiles accurately, often walking a fine line between pore pressure and fracture gradient as it drills and completes oil and gas wells. The industry also finds it difficult to predict pore pressure ahead of the drill bit, during exploration, creating concern for well control.
Pore pressure in the subsurface results from force-balanced mineral and fluid load-sharing relationships. Pore pressure (pp) and fracture pressure (pf) obey load conservation laws in earth's mechanical systems.
Overburden, porosity, effective stress, and strain combine, linking pp and pf together. Net permeability regulates subsurface fluid flow within the surface relative, fluid-pressure gradient and fracture pressure limits.
The industry uses many different suites of petrophysical sensors to estimate porosity, mineralogy, and fluid and formation densities, which all relate mechanically to pore pressure.
Pore pressure
Three mechanically distinguishable pore-pressure profile types relate directly to fluid density in the pore space and intergranular permeability.
Two pore-pressure profile types relate to hydrostatic pressure in sealed compartments and depend on whether brine saturation is 100% or whether hydrocarbons are present.
The third pore-pressure profile type occurs when fluid escape is restricted by low intergranular permeability or when hydrocarbon cracking occurs that significantly increases the number of molecules and pressure in the pore space.
Fracture pressure of the rock dynamically regulates fluid pressure by releasing fluid at the net, interfracture, and intergranular permeability limit.
In a normal fault regime basin or a geologic basin that has no appreciable built-up tectonic stress, the overburden pressure creates the maximum load limit.
Fracture propagation pressures, which are the lower horizontal load limits, dominate the pore-pressure profiles.
Overburden and fracture propagation pressures systematically relate to each other through differential stress minimization.
Partially open shear fractures, as created by faulting, can locally reduce compartment pressures to the mud line or water table relative hydrostatic pressure.
One can recognize each of these limiting conditions in pore-pressure profiles that depend on mechanical first principles.
Mechanical components
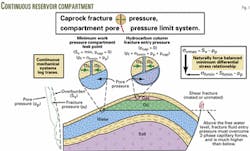
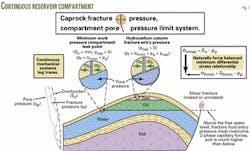
Fig. 1 shows the pressure-regulating elements of a generic pressure compartment. A continuous lithostratigraphic body, with greater than 10-md permeability, defines the compartment.
Most compartments encountered during exploration are in, or close to, a seal-relative hydrostatic state. This means that pressure equilibration time, relative to geologic time, is short at inter-granular permeabilities greater than 10 md.
The porous, permeable reservoir compartment contains water, oil, and gas legs, where the oil and gas are trapped in the compartment by an overlying low-permeability caprock (Fig. 1).
The fluids in the compartment can exist at pressures up to, but not greater than overburden pressure. The overburden load creates the maximum possible load, in a normal fault regime (NFR) basin. Permeability plays no part in this relationship.
The earth, a continuous fluid-solid mechanical system, generates fluid pressures from within. Fluid pressures cannot exceed the maximum vertical load and are generally regulated by minimum load, normally horizontal, in NFR basins.
Fracture propagation pressure is the minimum horizontal load by conservation law.
Granular solids compaction drives fluids from the pore space. The escaping fluids will follow the locally steepest pressure gradient until reaching the mud line or water table. Displaced fluids will follow the least resistant combination of intergranular and open fracture escape routes.
Caprock overlying a pressure compartment will have area-wide continuity and intergranular permeability in the 10-6 to 10-10 md range. That caprock will also contain mated subvertical fractures on the scale of inches to feet.
The caprock has only a net intergranular permeability, when these fractures are closed. Net vertical permeability increases by 104+ orders of magnitude when the fractures are opened.1
One can view mated caprock fractures as valves that remain closed at fluid pressures below fracture propagation pressure and open when pore pressure reaches caprock minimum load fracture pressure.
This relationship describes the workings of all physical valves. Permeability increases asymptotically as pore pressure approaches fracture propagation pressure.
All caprocks should be considered minimum-load closing, pore-pressure opening valves.
Engelder and Lacazette demonstrated hundreds of episodic natural hydraulic fracturing events on the walls of a long natural fracture.2 They proposed a poro-elastic theory to explain the inch-to-foot scale density of mated subvertical fractures in shales.
That geomechanical explanation concluded that fracture pressure is a natural limit to pore pressure.
Fig. 1 portrays two subvertical fractures in the caprock, one just below the free water level and the other above the compartment's gas cap.
The system does not have to overcome additional capillary resistances to force water through a water-wet fracture.
On the other hand, it would take about double the single-phase pressure to force gas and water through a similarly sized fracture above the gas cap.
Fracture closure pressure increases in proportion to effective horizontal stress at the compartment-caprock interface.3 4
The caprock's minimum work leak point occurs just below the free-water level, where fracture closure pressures are higher. Above the free-water level, fluid entry pressures are higher because of capillary effects.
One can calculate the fluid pressures in any compartment, as the fluid density times height difference from the minimum work leak point. This calculation involves Pascal's principle that is a mass and fluid pressure conservation law.
Fracture-pressure valves
Fracture closure pressure varies systematically with overburden, solidity, and effective stress or horizontal load conservation laws, which apply everywhere in the subsurface.
Fracture pressure, at the minimum work leak point, determines the pressures in the entire compartment through linked load and fluid pressure conservation laws.
In normal fault regime basins, the author found that the horizontal-vertical stress ratio relationship was directly proportional to solidity in all lithologies.5 The simple horizontal-vertical ratio corresponds to a mathematical minimum in the effective-stress-conservation law.4
The right inset rectangle of Fig. 1 shows that the vertical component of rock stress is normally the highest, and horizontal component the lowest, in a normal fault regime or geologic basin that is not currently experiencing tectonic stress.
Shear fractures may occur below the fracture pressure, pore-pressure limit. Resulting fracture walls are often unmated after shearing movements. Typically, shear fracture movement will open flow paths with Darcy range permeabilities along the fracture trace.
Temporarily over-stressed apices, on the irregular unmated fracture walls, prop open the shear fracture. The right side of Fig. 1 shows the example of one such fracture that can cut a compartment in any place.
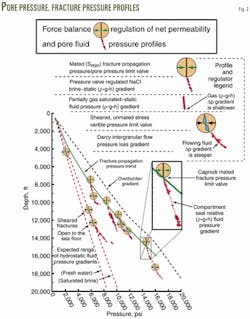
Fig. 2 shows a set of genetic pore-pressure profiles. The upper legend portion of the figure shows mated and unmated fracture types and three generic pore fluid pressure profile types, which are usually related.
Mated fractures, normal to the minimum principal stress occur widely in the subsurface. Sheared fractures do as well, but they tend to heal with time.
Pressure compartment water-saturated legs have fluid pressure gradients corresponding to NaCl brine density in the pore space. Continuous sets of repeat formation test profiles, indicated by plus symbols that are parallel to NaCl brine density, identify these legs (Fig. 2).
Pressure profiles, which are steeper, indicate hydrocarbons fill a fraction of the pore space.
For an indirect inference that a pressure compartment exists, one must observe a fluid pressure gradient (rgh) within the formation fluid range.
Pore-pressure profiles that are steeper than formation fluid gradients indicate additional flow resistance pressure drop. Profiles like the third one on Fig. 2 are associated with lower than 10 md intergranular permeabilities.
Pore-pressure profiles for partially water-saturated rocks fall within the lowest pore fluid pressure gradient and the fracture propagation pressure trend (Fig. 2).
Fig. 2 shows a set of genetic pore pressure and fracture pressure trend profiles adapted from R. A. Gaarenstroom.6 The hydrostatic profiles represent the fluid density gradients of fresh water and saturated NaCl brine with respect to the mud line.
Mated and sheared fracture symbols and the three recognizable pore-pressure profile types are shown.
Three sheared fracture pore-pressure profiles are shown on the left of Fig. 2. These lie close to the saturated NaCl brine limit that is characteristic for Central North Sea formation-water salinities. This geometric relationship infers an essentially unrestricted flow from these fairly deep compartments to the mud line.
Four fluid pressure gradients on this figure terminate at Gaarenstroom's fracture-propagation pressure trend, which are only a small sample of the 100+ profiles on the original figure. All profiles terminate at or below the minimum fracture propagation trend shown.
The fact that more than 300 leakoff tests, measured in the original study, were between the minimum fracture pressure and overburden trends confirmed that validity of general force-balance calculations (Fig. 2). All of Gaarenstroom's data demonstrate consistency of overburden, pore pressure, fracture pressure, and Pascal's principle conservation laws.
Seven sheared fracture profiles appear on Fig. 2, and are all within the allowable conservation law range. Those that tail to the higher-pressure side probably demonstrate additional upward flow restrictions.
Inter-granular permeability limits fluid flow toward the surface when the mated fractures are not held open by pore pressure. The conservation law mechanical systems limits and intergranular permeability interact as described previously.
The individual wellbore specific pore-pressure profiles intersect the in situ three-dimensional fluid pressure field.
The fluid pressure field is interdependent with solid effective stress field in the earth's subsurface.
All the above describes an earth geomechanical system that is consistent in every regard with other force-balanced mechanical systems.
Hysteresis
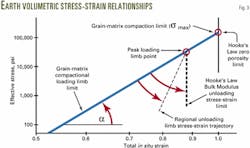
The granular solids that compose the earth's sediments and sedimentary crust compact along a loading limb. Two power-law coefficients define the loading limb at natural gravitational loading rates (Fig. 3).
Grain-matrix compaction terminates at 0% porosity or 100% solidity at an effective stress value, sigma max (smax). Alpha (a) defines the stress-strain exponent along the power-law loading limb path (Fig. 3).
Effective stress increases with burial compaction. The natural stress-strain trajectory occurs along the loading limb path, as long as fluid volume in the pore space does not increase and overburden is not removed.
The loading limb path for a sediment or whole rock must consist of the weighted average of mineral specific alpha (a) and sigma max (smax) coefficients. The maximum effective stress reached during natural gravitational loading occurs at the peak loading limb point.
When a core is taken from depth and brought to the surface, it follows an unloading limb trajectory. During early and intermediate unloading expansion, as the core is brought to surface, the Hooke's law bulk modulus stress-strain trajectory follows the tangent heavy dashed line (Fig. 3).
The compactional loading limb and the Hooke's law unloading limb bound all other natural stress-strain trajectories, which would intersect at the peak loading limb point.
Microfracturing of cores during unloading and natural fluid expansion can take an intermediate unloading limb trajectory as indicated by the light dashed trace (Fig. 3).
Workers must calibrate the unloading limb trajectory for specific regions.4 7 The specifics of natural fluid expansion unloading include some increase in fracture porosity.
Resistivity and density petrophysical logs will represent the magnitude but not the mode of porosity.
Stress calibration
Workers used six wells in a Carnovan Basin northwest of Australia to establish a Far East regional unloading limb stress-strain exponent. They used resistivity, bulk density, and p-wave interval transit time to determine in situ strain. Log analysts estimated shale volume from a baseline normalized gamma-ray log.
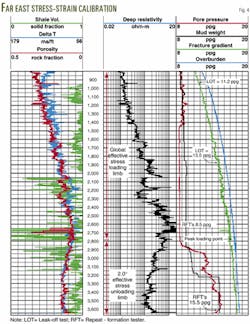
Fig. 4 presents one of the six regional calibration wells that were processed with the single set of regionally derived coefficients. The wells presented a high pressure, high-temperature unloading environment.
Baseline normalized gamma-ray readings, reported in volume fraction shale, appear in Track 1. The log also reports porosity and mineralogy sensitive bulk density and transit time readings in Track 1.
The log shows porosity in the 0-50 porosity unit scale of Track 1, as derived from "m" variable resistivity.
Engineers empirically established a regional average shale-grain density profile and the formation-water conductivity profile.
Mud weight profiles and repeat-formation tester (RFT) readings allowed calibration of relative and absolute pore fluid pressure in each well. Leakoff tests allowed calibration of fracture propagation pressure.
Engineers evaluated pore pressure and fracture pressure data from all six wells to determine the regional mechanical and petrophysical relationships, weighted equally.
Deep resistivity data appear in Track 2. The peak loading point indicated on the logs separates the loading and unloading effective stress regimes.
The log shows a peak loading point, at 2,775 m, that is a regionally continuous peak solidity caprock, like that shown on Fig. 1 and represented in stress-strain space of Fig. 3.
The six wells, with use of a single unloading limb calibration, cover an area of hundreds of square miles.
Track 3 displays overburden, fracture propagation pressure, mud weight, and pore fluid pressure in ppg as fluid pressure gradients. The log also annotates leakoff tests and RFTs in Track 3.
RFTs closely match force-balance calculated pore pressures. The mud-weight profile generally exceeds the calculated pore-fluid pressure. The green fracture-pressure trace exactly matches the upper leakoff test, indicating that initial overburden calculation was correct.
Evaluating all the traces, engineers can readily interpret the comparable loading-limb, peak-loading point, and unloading-limb features of Figs. 1 and 3. The log shows a decreasing porosity trend to the peak-loading point, followed by an increasing porosity trend.
Over the entire log interval, the peak-loading limb point occurs at the maximum fracture pressure and minimum calculated porosity. The depth space in Fig. 4 corresponds to the stress-strain space of Fig. 3, about the peak-loading limb point.
Drillers were unable to detect a 3-ppg underbalanced condition, from 2,850 to 3,225 m, at the surface. Drilling mud gas did not provide adequate warning.
This well and some of the other calibration wells required shut-in to control unpredicted pore pressure. One of the calibration wells required hole abandonment and side tracking to reach the drilling objective.
The general, regional unloading-limb pore pressure prediction matched the measured RFT pressure in this well at 3,650 m, with similar success in the other calibration wells.
Real-time prediction
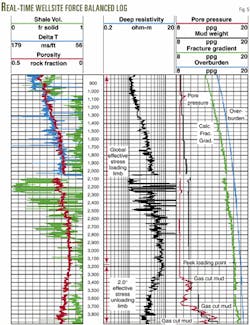
Fig. 5 shows the log generated from the final well of the six-well program, using combined wireline and MWD petrophysical data. No adjustments were made to any of the regionally derived constants or control profiles for the entire duration of the well.
The log shows an easily recognizable peak loading point at 3,175 m. The same 2.0°-unloading limb exponent was used below the peak loading-limb point.
Success in predicting three gas-cut mud incidents eliminated initial skepticism in the force-balanced method of determining pore pressure.
The real-time pore pressure log indicated underbalanced mud weight at 3,380 m. The first gas-cut mud incident occurred at 3,400 m and the mud weight required to kill the well of 10.5 ppg was in agreement with the real-time pore pressure log.
The drillers raised the mud weight to 10.7 ppg at 3,480 m, in preparation for setting casing, and achieved the primary objective of setting casing in the top of the overpressured interval.
The onset of elevated pore pressure occurred 200 m below the peak loading-limb point and 200 m below the resistivity reversal, on the raw resistivity log.
The regional 2.0°-unloading limb stress-strain calibration has proven correct, in light of the gas-cut mud and required kill weight mentioned above.
After setting casing, crews raised the mud weight to 11.6 ppg and drilled ahead. The pore pressure increased sharply to 11.6 ppg at 3,725 m. Engineers predicted the mud weight to become underbalanced at 3,750 m.
This preceded gas-cut mud, requiring crews to raise the mud weight to 12.3 ppg, temporarily controlling the well. Gas-cut mud occurred again at 3,800 m, requiring crews to raise the mud weight again to the eventual kill weight of 14.8 ppg, which agreed with real-time pore pressure measurement.
Flowing and kill mud weights bracketed the force-balance calculated pore pressure to within 0.2-ppg accuracy. The closed-form force balanced calculations generated the accuracy of pore-pressure predictions.
This field case corresponds to a regional loading-limb regime over a very aggressive fluid expansion pressure regime.8 Engineers made the mechanical systems predictions through a combination of global loading limb and regionally calibrated unloading limb relationships.
The operator derived several benefits from field pore-pressure calculation. Crews circulated out gas-cut mud without shutting in the well. The operator reached the drilling objective with one less casing string.
Applying force-balance physics to calculate pore pressure allowed the operator to meet safety and cost objectives.
References
1. Walsh, J.B., "Effect of Pore Pressure and Confining Pressure on Fracture Permeability," International Journal of Rock Mechanics, Mining Science & Geomechanics, 1981, Vol. 18, pp. 429-35.
2. Engelder, T., and Lacazette, A., Natural Hydraulic Fracturing, in Barton, N., and Stephansson, O., eds., Rock Joints, A. A. Balkema, Rotterdam, 1990, pp. 35-44.
3. Holbrook, P.W., "The universal fracture gradient/pore pressure force balance upper limit relationship which regulates pore pressure profiles in the subsurface," Pressure Regimes in Sedimentary Basins and their Prediction, AADE Industry forum, Sept. 1-4, 1998, Del Lago, Tex.
4. Holbrook, P.W., Pore Pressure through Earth Mechanical Systems; the Force Balanced Physics of the Earth's Sedimentary Crust, 136p, Force Balanced Publishing, Houston, Jan. 2001.
5. Holbrook, P.W., "The Use of Petrophysical Data for Well Planning, Drilling Safety and Efficiency," SPWLA 37th Annual Logging Symposium, June 16-19, 1996.
6. Gaarenstroom, R.A., Tromp, R.A.J., DeJong, M.C., Brandenberg, A.M., "Pressures in the Central North Sea: implications for trap integrity and drilling safety," Petroleum Geology of Northwest Europe: Proceedings of the 4th Conference, edited by J.R. Parker, pp. 1305-13.
7. Holbrook, P.W., "Method for determining regional force balanced loading and un-loading pore pressure regimes and applying them in well planning and real-time drilling," Chapter 7 in Pressure Regimes in Sedimentary Basins and their Prediction, AAPG Memoir 76, A. Huffman and G Bowers (eds.).
8. Barker, C., "Calculated Volume and Pressure Changes During Thermal Cracking of Oil to Gas in Reservoirs," AAPG Bull, Vol. 74, No. 8, pp. 1254-61.
The author
Phil Holbrook ([email protected]) consults on petrophysics, earth in situ, and borehole relative force balance, and performs applications research projects and teaches. He worked for Gulf Oil Corp. for 8 years as an exploration geologist-geophysicist and at Gulf's research and development organization in Houston. He coordinated Gulf's experience-broadening program for new geologists, equivalent to an MS in exploration geophysics, and conducted research on petrophysical oil exploration applications. He worked at Exxon Production Research Co. for 8 years and joined Sperry-Sun in 1984. He holds a PhD (1973) in geology from Pennsylvania State University.
