Rigsite chemostratigraphy provides timely formation evaluation tool
Operators now have access to rigsite chemostratigraphy (chemical stratigraphy) to provide timely information for formation evaluation, picking formation tops, and identifying horizons for coring or casing points.
Previously, technicians could only provide chemostratigraphic analysis, or "formation fingerprinting" on cuttings and core samples using the rock's geochemistry, in the laboratory.
Halliburton Co.'s Sperry-Sun Drilling Services and Westport Technology Center International, Houston, in alliance with UK-based Chemostrat Ltd., began in June providing rigsite chemostratigraphy service using laser-based technology.
The group developed a device known as a laser-induced breakdown spectral (LIBS) instrument, which they call LaserStrat.
Veba Oil & Gas Netherlands BV successfully tested the technology during development drilling in an offshore field in the Dutch North Sea.
Veba used it to detect critical casing points within the base Tertiary shale, just above the chalk reservoir section. The objective was to set the casing as close to the top of the chalk as possible, without actually penetrating it, using the base Tertiary mudstone as a marker.
Veba reported that the LIBS instrument was a viable competitor to conventional wellsite biostratigraphy.
The LIBS technology works because apparently homogeneous sediments contain a great deal of geochemical variability. This is the case with the base Tertiary shale and Tertiary shales above it in the Dutch North Sea field.
The operator reported that the LIBS technology-based device was robust, provided rapid turnaround time, and had a favorable cost-benefit ratio. Chemostratigraphic correlations are typically produced within 20-30 min. of samples being collected from the shale shakers.
Veba is currently testing and evaluating rigsite chemostratigraphy as a guide or tool for geosteering horizontal wells, during continued drilling in the same field.
Theory
Chemostratigraphy is the characterization and correlation of strata from the inorganic geochemical or elemental composition of sedimentary rocks. Sediments that appear homogenous in most physical respects often have significant geochemical variability.
The geochemistry or elemental composition depends on the source of the sediments during deposition (provenance), age of formations, and changes that may have occurred with time due to sedimentary exposure to formation water, pressure, and temperature in the subsurface environment (diagenesis).
Various elements originally deposited within formations have been affected in different ways by these geological processes. Geologists can use this fact to maximize the information from chemostratigraphic analysis.
Engineers can apply chemostratigraphy to any sedimentary basin, any geological sequence, and sequences of any geologic age. No prior knowledge of the geological setting is required.
Operators can use the geochemical composition of sedimentary rocks to provide increased understanding of wireline log response.
Laboratory studies
Engineers normally apply wellsite chemostratigraphy to individual wells against the backdrop of larger reservoir, regional, and basin wide geochemical studies.
Formation strata geochemistry and zone markers are identified during the course of these studies, which require more elaborate analysis of cuttings and core samples than what can be done at the wellsite with the LIBS instrument.
Current laboratory chemostratigraphic methods are not based on LIBS, but rather on inductively coupled plasma (ICP) technology. Formation samples are either digested by strong acids or fused in a furnace and then introduced into a radio-frequency-induced plasma, in the form of a solution or vapor.
The plasma temperature reaches 6,000 K. at the center and 8,000 K. at the periphery. Most atoms are converted to ions at the high thermal energy and electron-rich environment of the ICP.
Atomic emission spectrometry (AES) and mass spectrometry (MS), used in conjunction with the ICP give the concentrations of 50 elements. The technique is applicable in all sequences and lithologies.
Cuttings samples, normally collected during drilling of all wells, are best suited for construction of regional chemostratigraphic frameworks.
Core samples, on the other hand, provide much higher resolution for zone correlations within reservoirs and between wells.1 Cores have better depth control and the rock material taken from the core is not subject to mixing as in the case of cuttings.
Laboratory based chemostratigraphy using ICP-AES/MS yields more complex strata characterization than LIBS, including:1
- Complex stratigraphic successions.
- Provenance or sediment material source studies.
- Detailed reservoir-scale correlations.
- Subdivision of sequences.
- Solution of correlation problems.
- Reservoir characterization.
- Diagenetic or change after deposition studies.
ICP analysis requires extensive sample preparation and a clean laboratory environment, which increases both time and cost, and precludes field-based studies.
Sediment source
Geologists often need to know the source or provenance of sedimentary material, as well as where and how it was deposited. Formation material source information gives clues to relationships that may or may not exist between different sections of a reservoir.
Two wells, drilled some distance apart, may appear to cross the same formations, based on lithology or rock type and other physical characteristics. The geochemistry of formations in the two wells, however, may be the only clear indication that the zones are not the same or do not have the same origin.
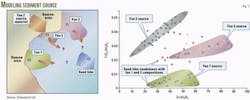
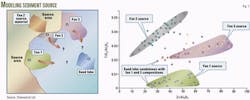
Fig. 1 depicts an example of a well drilled in a sand lobe with uncertain origin. The operator needed to know which of three possible fan systems had provided the sedimentary input to create the lobe.
Geochemical data indicating differences in the heavy mineral elements, titanium (Ti) and zirconium (Zr), distinguished the three fan systems from one another:
- Low TiO2/Al2O3 ratio and moderate Zr/Al2O3 ratio characterized Fan System One.
- Fan System Two had moderate Zr/Al2O3 ratio and high TiO2/Al2O3 ratio.
- Fan System Three had high Zr/Al2O3 ratio and moderate TiO2/Al2O3 ratio.
When geologists reviewed geochemical data from the unknown sand lobe and plotted it against the data from the three fan systems, it was clear that the sand lobe had been created primarily from fan system three.
Regional correlations
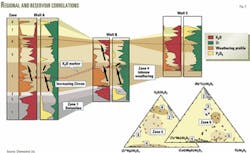
Fig. 2 depicts the results of a large-scale regional study from the Middle East. The mobile alkali elements such as potassium, shown as red in the well log depictions, were used to model changes in climate over geologic time (paleoclimate).
Formations or zones affected, to varying degrees, by weathering are readily profiled by the presence or depletion of potassium. Zones that have experienced potassium depletion, which means they have experienced intense weathering are shown in orange.
In addition to weathering effects, zirconium, shown in green in the well log depictions (Fig. 2), allow geologists to make provenance-related or zone material source-related correlations.
By using a series of graphical and statistical analyses, geoscientists define and quantify the zones from visual analysis of the geochemical profiles.
The ternary diagrams in the lower right corner (Fig. 2) show how zones are grouped into regions of the graphs.
These ternary diagrams demonstrate how one can rapidly incorporate additional wells into the existing chemostratigraphic framework.
At the reservoir level, engineers frequently require detailed correlations to determine the lateral continuity of sandstone bodies between wells. Similarly, one may question the lateral connectivity of a mudstone reservoir seal or caprock across the reservoir top.
Geologists can correlate the geochemical signatures of strata across the field to verify continuity. Core samples are more appropriate for these studies, with sample spacing 1-3 m, along the core length.
LIBS technology
Laboratory based chemostratigraphy, using ICP-AES/MS, is not practical at the wellsite. Advances in laser-based instruments and related technology, however, have led to development of the laser-induced breakdown spectral device that can replicate much of the type of data currently obtained by ICP-AES analyses.
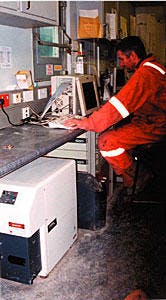
Rig personnel can readily use the LIBS device at the wellsite because it is small and self-contained. It can be used as a stratigraphic tool to identify horizons and provide chemostratigraphic correlations with offset wells in near real time.
The instrument requires minimal sample preparation. Cuttings from the shale shaker are carefully selected, to represent the formation of interest, eliminating foreign material such as pipe dope and other debris.
The sample to be inserted into the LIBS instrument is then prepared by use of a proprietary technique. Basically the carefully chosen cuttings are ground into a powder and pressed into a wafer about the size of a large shirt button.
The laser-induced breakdown spectral instrument uses a focused laser pulse to create a high-temperature plasma just above the surface of the sample wafer, causing a small amount of sample material to be ablated into the plasma.
The sample material instantly ionizes and the electrons in the various elements are excited to higher energy states. As the plasma cools and dissipates, the electrons fall back to their normal energy states, emitting ultraviolet and visible radiation in the process.
By measuring the calibrated intensity of the ultraviolet-visible radiation at specific wavelengths, it is possible to determine elemental concentrations.
Currently, 10 major elements reported as weight percent oxide (SiO2, Al2O3, TiO2, Fe2O3, MnO, MgO, CaO, Na2O, K2O, and P2O5) can be determined with a precision of 3-5%, and ten trace elements reported as parts per million (Ba, Cr, Cu, Li, Ni, Sc, Sr, V, Zn, and Zr) with a precision of 5-8%.
LIBS technology is best suited for large-scale clay dominated correlations and for screening new formations. It is not suitable for complex sedimentary sequence analysis, provenance or sediment source studies, detailed reservoir-scale correlations, or sandstone-dominated sequences.
Two operators, however, are participating in a study with Chemostrat to develop chemostratigraphy as a technique that is applicable in the Gulf of Mexico. Two pilot studies are currently underway in the Brazos and Mississippi Canyon areas, with a third pilot study planned for Gulf of Mexico in 2001.
The limitation of LIBS regarding sandstones is related to the sample wafer behavior during the laser ablation process, not to the underlying physics. Work is underway to resolve the problem, during the course of the Gulf of Mexico studies.
Coring, casing points
Engineers must continually be aware of the distance left in a hole section as rigs drill toward coring and casing points.
Fig. 4 shows how Veba Oil & Gas used wellsite chemostratigraphy and the LIBS instrument to distinguish between zones in the Tertiary shales, to pick the casing point. It was imperative to set casing as close as possible to the base of the Tertiary without actually penetrating the chalk reservoir.
The well log depiction at the top (Fig. 4) shows the geochemical profile behavior as the rig drills through each shale layer. The operator reports that the shale zones appear homogeneous in all respects except for geochemistry.
The four plots at the bottom (Fig. 4) show how graphical and statistical analyses of geochemical data identifies the base Tertiary shale, which plots at the lower right corner of each graph.
An importance point to stress is that the shale elemental composition is not affected by geologic age and its geochemical features are always present.
Geosteering
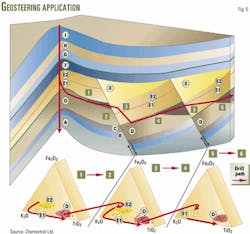
The LIBS technology and wellsite chemostratigraphy adds another tool to the geologist's and engineer's options, when it comes to geostreering. Fig. 5 shows a deviated well that was drilled to recover oil from fault trapped reservoirs of formation D.
The operator can see distinct geochemical features on the ternary diagrams, identifying cuttings from the reservoir and adjacent formations, as the well is being drilled.
In this example, formation D is characterized by low potassium (K), titanium (Ti), and iron (Fe) values. Whenever the drill bit intersects zone E, the geochemistry shows a marked sudden change with an increase in the potassium value (Fig. 5).
When comparing wellsite chemostratigraphy to other measurement-while-drilling (MWD) tools, in terms of response time, one must consider the information time lag of both instruments.
The lag time for MWD tools depends on the drilling rate or penetration rate and how far the MWD tools are behind the bit.
The lag time for the LIBS instrument is a function of the mud circulation rate or time required to transport cuttings to surface and the time required to collect and analyze the cuttings sample.
Depending on well conditions, information from both technologies may become available within the same time frame.
Wellbore stability
Operators often observe drill cuttings at the shale shaker that have different size and shape than one would expect to see coming from the drill bit. The bit normally produces cuttings that are small, angular-shaped, and consistent in size, depending on the type of bit used.
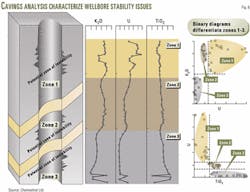
Wellbore stability issues, low mud weight, mud-formation compatibility issues, and over-pressured low permeability zones are just some of the problems that can produce large and unusual shaped cuttings, which can originate from any location in the open wellbore.
Fig. 6 illustrates how engineers can use geochemistry to diagnose the cause of wellbore stability issues.
The operator observed pressure cuttings after drilling to TD and identified zone 1 as the source, by the sediment's elemental composition. Sediments from zone 1 are geochemically characterized by high potassium (K) and uranium (U), but low titanium (Ti).
Zone 3 sediments, on the other hand, have low K and U, but high Ti. Zone 2 sediments have high K, low U, and moderate Ti. The binary diagrams at the right (Fig. 6) differentiate the zones.
A significant proportion of the world's hydrocarbon reservoirs occur in sequences which have very poor stratigraphic control.1
Operators must sometimes base tenuous correlations on similar lithological or petrophysical properties.1 The availability of a new technology to enhance formation evaluation and cross check existing information, can only increase successful economic development of hydrocarbon reserves.
Acknowledgments
The author thanks M.C. Dix, Halliburton Co., and A.M. Wright, Chemostrat Ltd., for their help in this article.
Reference
- Pearce, T.J. and Jarvis, I., "High-resolution chemostratigraphy of Quaternary distal turbidites: a case study of new methods for the correlations of barren strata," in Dunnay, R.E., Hailwood, E.A. (editors), Non-bio- stratigraphical Methods of Dating and Correlation, Special Publication, Geological Society, London, 1995, Vol. 89, p. 107-143.
