Profile indicator helps predict pipeline holdup, slugging
An indicator has been developed quantitatively to characterize pipelines based on the propensity of their profiles to induce liquid holdup.
The pipeline profile indicator (PI) constitutes an additional engineering tool to be used from conceptual design to operational studies of multiphase pipelines.
With PIs, multiphase pipelines can be compared with one another or placed on an empirical scale to evaluate possible operating difficulties at low flow rates.
Moreover, preliminary profiles for future pipelines can be made to resemble other pipelines passing over similar terrain and thereby yield realistic calculations at an early stage.
Discrepancies in PI value before and after profile simplification can reveal inadequacies in the simplification processes and aid in defining the intervals into which the pipeline segments are classified before redistribution.
Terrain influences
In the simulation of transient flow in gas-condensate pipelines, accurately modeling profile is particularly important because of the major influence of slopes on the liquid inventory held-up in the pipeline and therefore on slug-catcher design and pipeline operating philosophy.
These, in turn, affect capital expenses and operating expenses of a multiphase transportation system.
With the PI, TotalFina has developed a means of quantifying the influence of the pipeline profile on the liquid holdup.
An important aspect of this new profile indicator is that it is a measure not only of the pipeline geometry, but also of the propensity of that geometry to accumulate liquid. It will indicate whether one pipeline profile is more or less likely than another to induce holdup.
The PI was initially intended to be used to validate an estimated or simplified profile for use in computer simulation of multiphase flow. It can also be used, however, in conjunction with an empirical scale of gathering indicators of existing multiphase pipelines with known transient behavior, as a comparative "rule of thumb" in evaluating the magnitude of profile-induced holdup in a proposed pipeline.
Comparing future pipelines against this scale allows possible operating difficulties to be anticipated and solutions to be engineered into the project.
Other uses include simplification of pipeline-profile data for transient simulation studies without modification of the transient behavior or building realistic profiles for pipelines in known territory but where no detailed survey is available.
Liquid behavior
In a gas-condensate pipeline, the liquid present at a given location varies with gas flow rate. At low flow rates, the gas has difficulty sweeping the entrained liquid along the pipeline and liquid accumulation (or holdup) occurs.
At high flow rates, however, the liquid is more easily swept along, and liquid holdup is low and of limited impact on the pressure drop.
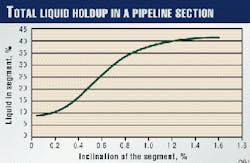
The effect of liquid holdup is more pronounced in the uphill sections of a pipeline where significant hydrostatic pressure gradients can be induced. Fig. 1 illustrates how, for a given low flow rate, liquid holdup varies with gradient.
In this example, liquid holdup, expressed as percentage of cross-sectional area, varies by a factor of 4 for a one percentage point change in pipeline gradient.
Once holdup has occurred, slugging can be induced by changes in flow rates or at low points in the pipeline. When the flow rate in a multiphase pipeline is increased, steady-state liquid holdup is reduced. Therefore, a volume of liquid equal to the difference in holdup between the old and new flow rates is ejected, sometimes in the form of slugs.
At low flow rates, liquid accumulation at the bottom of uphill sections can generate intermittent slugs that can propagate and grow towards the pipeline outlet. Operational slugging or terrain-induced slugging of this nature has been described elsewhere.1 2
Confidence in the results of multiphase flow simulations for a pipeline requires certainty that the profile used is well defined.
Calculating pipeline PI
Developing the PI used the following step-wise approach:
- Identified a set of reference fluid and flow conditions for a pipeline and simulated or quantified the impact of slope on the liquid holdup in this pipeline at these conditions.
- Developed a mathematical correlation between slope and liquid holdup in these conditions.
- Used this mathematical correlation to quantify liquid holdup in a pipeline (characterized as a sequence of sections of different slope) at these reference conditions.
There are two ways to interpret the measure that this approach produces.
First, it is an absolute measure of the holdup expected in reference conditions, which of course may be distant from the real operating regime.
Second and more importantly, in the context of this work, it also shows whether one profile is more or less likely to induce liquid holdup than another.
Selecting reference conditions
Experiments carried out in the validation of multiphase flow simulation software have demonstrated that as gas superficial velocity is reduced, liquid holdup in inclined pipelines becomes largely independent of the gas-liquid ratio (GLR) of the transported fluid.
As gas velocity drops, however, liquid holdup becomes more and more sensitive to gradient, to the point where, at very low flow rates, it resembles a step function.
Thus, an ideal set of reference conditions will be at a velocity which is low enough to reduce to a minimum the influence of GLR but not so low as to create a binary PI which changes from one value to another over a very short change in gradient.
A fluid of GLR of 0.028 vol/vol in a pipeline with superficial gas velocity of 2 m/sec was found to meet these criteria.
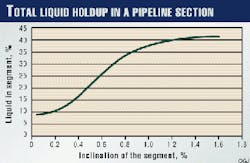
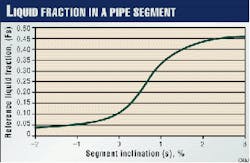
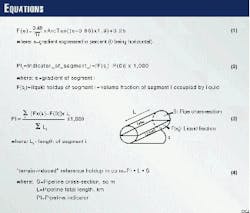
At these conditions, studies show that the variation of pipeline liquid holdup over a range of gradients can be approximated by the function shown in Equation 1 (see accompanying equations box). This function is shown graphically in Fig. 2.
To account for the impact of non-horizontal gradients only, the PI of a given sloping section of the pipeline (or segment; Ii ) is given by Equation 2.
Multiplying by 1,000 makes for a rational formula when estimating holdup (Equation 3).
The indicator for an entire pipeline (PI) is obtained by computing the "length-weighted average" of all segment indicators Ii.
The pipeline indicator, as defined by Equation 3, is:
- Dimensionless.
- Independent of pipeline length and diameter.
- Independent of the fluid transported.
- Independent of the operating conditions.
- Equal to zero for a perfectly horizontal pipeline.
- Of equal value for two pipelines with the same distribution of segment inclination.
- Of equal value for two pipelines having the same liquid holdup in reference conditions.
- Easy to calculate from pipeline profile data only.
The PI can easily be implemented in a spreadsheet, as a means to "measure" the propensity of a pipeline to accumulate liquid and as a "yardstick" against which two pipelines can be compared.
Interpreting PI, typical values
As stated, because the PI is based on an approximation of liquid holdup at low flow rates and because holdup of perfectly horizontal segments is eliminated, the PI is a measure of the additional holdup due to positive gradient, or terrain-induced holdup, at the same low flow rates.
In pipeline segments with negative gradient, the indicator is also negative, and the influence of reduced holdup in downward sloping segments is accounted for in the indicator value for the pipeline.
In that sense, multiplying the PI by pipeline cross-section (in square meters) and by pipeline length (in kilometers) yields an approximation of the terrain-induced holdup of a given pipeline at the reference conditions.
Because the actual operating conditions are very unlikely to be the same as the reference conditions, however, it is not suggested that the indicator be used to size a slug catcher. This type of calculation is presented here to give added meaning to what the indicator actually measures.
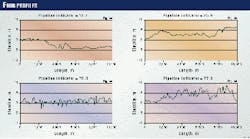
As an illustration, the pipeline indicator has been calculated with profile data for four pipelines. The profiles, together with their respective PIs, are shown in Fig. 3; for ease of visual comparison, all four profiles are plotted on the same vertical and horizontal scales.
- Fig. 3a shows a relatively smooth profile with few sharp peaks or deep troughs. The PI is 13.7.
- The profile in Fig. 3b is also smooth with no significant peaks or troughs, but because it rises over its length and is made up of more or longer uphill segments than pipelines in Fig. 3a, the PI is 25.9, double that of the profile in Fig. 3a.
- The profiles in Figs. 3c (PI 70.8) and 3d (PI 77.4) show two particularly hilly profiles.
The pipeline in Fig. 3c "oscillates" around pseudo-constant elevation, whereas the pipeline in Fig. 3d rises steadily over its length. The relative difference in PI value, however, is much less than for pipelines in Figs. 3a and 3b. This demonstrates that, for very hilly profiles, an overall rising or falling trend has a limited influence on PI value.
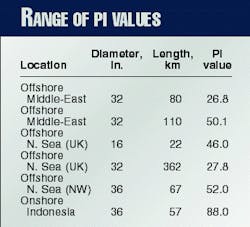
More PI values for existing pipelines or planned pipelines have been calculated and are given in Table 1 to illustrate the range of typical values that can be expected.
Use of the PI
As a means of comparison: TotalFina's experience in gas-condensate pipeline design, study, and operation has led to development of an empirical scale shown in Table 2 to give meaning to the numerical value of a pipeline indicator.
- PI values less than 20 are very seldom encountered in reality and are often the sign of an oversimplified profile.
- Very high PI values mean that pipeline liquid holdup at low flow rates is drastically higher than at high flow rates. Spontaneous intermittent terrain-induced slugging can be expected at low flow rates, and increases in flow rate can provoke ejection of large quantities of liquid as a slug.
- Care must be exercised, however, when using the empirical scale.
A long, relatively flat, offshore pipeline ending in a vertical riser will have a low PI value but could be subjected to severe slugging problems because of the riser alone.
In cases in which a pipeline crosses markedly different terrains, the profile can be split into sub-profiles and a PI calculated for each sub-profile.
As a means to make over-simplified profiles more complex: Multiphase pipeline design relies increasingly on the use of dynamic simulators, such as OLGA, TACITE,3 or PLAC, to predict transient behavior. These applications have been validated against extensive experimental data as well as field measurements.
Accurate and reliable prediction of pipeline liquid holdup depends greatly, however, on the level of detail of the pipeline profile. At the conceptual design stages of a project, a detailed survey of the future pipeline route is seldom available.
Pipeline profile data for simulation work are often taken from a crude bathymetric survey or terrestrial map.
Fig. 4 shows the impact of the level of detail of a pipeline profile on liquid holdup calculation results. In this example, OLGA was used to simulate the same pipeline with two profiles, one lifted from a map, the other the result of a detailed pipeline survey.
At high flow rates, where holdup is largely independent of profile, the two curves coincide. At low flow rates, the two curves diverge. Thus, holdup predicted by the survey data is higher than that calculated with the simple map profile.
The effect of such a simplification would be evident in the design of a slug catcher for this pipeline. Slugs ejected on rapid increases in flow rate correspond to the difference in pipeline liquid holdup at initial and final flow rates.
In this case, calculated slug size on a rapid flow rate increase can vary by as much as 1,660 cu m or 25%, depending on the pipeline profile used in the holdup calculations.
Profiles lifted from maps are often oversimplified and give rise to underestimation of liquid holdup and consequent slug size. Underestimation of slug size leads to undersized slug catchers and consequent operating difficulties or constraints following start-up.
The pipeline indicator can be used to evaluate the degree of over-simplification of a profile lifted from a map and, subsequently, to control the degree of complexity should the profile be rendered more complex.
Typically, the procedure is as follows:
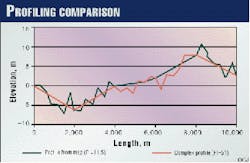
- The PI for a future 32 in. (0.78 m ID) x 10-km pipeline, whose profile has been lifted from a coarse bathymetric survey, was found to be 11.5. Comparison with the empirical scale (Table 2) indicates that this value is exceptionally low.
- The as-built survey for another pipeline in the same area yielded a profile whose PI is 51.
- With Equation 4, the potential impact on liquid holdup, slug size, and slug catcher dimensions at the reference gas flow rate of 2 m/sec of 189 cu m = (PI1-PI2) · L · S = (51-11.5) · 10 · 0.478.
In this instance, either a more-detailed map is obtained from which a new profile is developed, a detailed survey is carried out along the pipeline route, or the profile must be made more complex by artificially adding terrain details until the PI value approaches 51.
The original profile with PI 11.5, lifted from a map, and a profile rendered more complex with PI = 51, are shown superimposed in Fig. 5.
As a means to simplify profiles for dynamic simulation: Existing pipelines can require dynamic simulation when new operating conditions are envisioned or if new fluids are to be transported. In cases such as this, the detailed as-built survey is usually available.
Using that detailed profile in its entirety, however, can lead to lengthy and expensive computer runs. In order to reduce computing costs, detailed profiles are often simplified.
Simplifying a detailed profile by hand tends to smooth out rises and falls in the pipeline profile, thereby reducing calculated liquid holdup at low flow rates.
Following another methodology, OLGA contains a module, called Grid Generator, to simplify profiles. It takes account of all the segments in a detailed profile before placing segments with the same (or similar slope) together to form longer segments of constant slope.
This reduces the total number of segments and makes for shorter calculation times.
The PI can be used to evaluate the adequacy of a profile simplification. Fig. 6a shows a detailed profile obtained from an "as-built" survey with a crude profile simplified by hand.
The crude profile follows the general trend of the as-built survey, but over-simplification and the disappearance of the succession of rises and falls causes the PI to drop from 55.6 to 11.8. Simulations using this simplified profile will give grossly underestimated results for liquid holdup at low flow rates.
Fig. 6b shows the same detailed profile (having a PI of 55.6) with a profile simplified by use of the OLGA Grid Generator and its default options. The simplified profile contains far fewer segments, and the value of the PI is 61.4.
For simplified and full profiles with this magnitude of difference in PI value, simulations give similar liquid holdup value for low flow rate. Simulations of three-phase (gas-condensate-water) pipelines, however, have revealed that a 5% difference in simplified profile PI value can lead to a 50% difference in calculated water holdup at intermediate flow rates.
Therefore when simplifying a profile from survey, it is recommended to check that the PI before and after simplification is the same.
Based on TotalFina's experience, the correct profile simplification validated using the PI ensures conservation of holdup and of overall pressure drop predictions.
Acknowledgment
The author wishes to thank TotalFina for authorizing the publication of this article and the process department of TotalFina E&P, especially G. Woodward, G. Edward, D. Larrey, and J.C. Forestier for their advice and support.
References
- Daniel, L., "Dealing With Two-Phase Flows," Chemical Engineering, June 1995.
- Burke, N.E., and Kashou, S.F., "Slug Sizing/Slug Volume Prediction, State of the art Review and Simulation," Offshore Technology Conference, Houston, May 1-4, 1995.
- Dhulesia, H., and Lopez, D., "Critical Evaluation of Mechanistic Two-Phase Flow Pipeline and Well Simulation Models," SPE Annual Technical Conference, Denver, Oct. 6-9, 1996.
The Author
Bertrand Barrau is a production engineer for the Tunu field operated by Total Indonesia. He is currently based in Balikpapan, East Kalimantan. Barrau was previously a process engineer in TotalFina, Paris. He graduated from the
