Pig behavior provides data for monitoring pipeline geometry
To inspect and monitor cost effectively the seabed geometry of their newly laid pipelines offshore Nigeria, Moni Pulo Ltd. and Brass Exploration Unlimited deployed a system that tracks the progress of a pig as it moves along the line.
The SAAM (smart acquisition and analysis module) pipeline-inspection system was developed by RST Projects, Edinburgh, as a cost-effective means of benchmarking a pipeline's vertical geometry.
Subsequently, Moni Pulo and Brass Exploration will be able to monitor this geometry for changes over time. This is particularly important because of the abnormally volatile seabed conditions that exist in this project and strong currents particularly during the rainy season.
The one pipeline and two flowlines have been laid on a seabed that exhibits a variety of conditions, from being covered in a varying layer of soft silt, to being relatively firm. The patented (UK) SAAM inspection system has already been used to survey successfully the 12-in. pipeline.
Data from a second survey of this line have now been used to map movements of the pipeline on the seabed. Further surveys of this line and the two 8-in. lines are on the horizon.
The approach taken to the project has involved using an innovative technological solution to overcome nonstandard and difficult conditions.
Abana field
Moni Pulo Ltd., Lagos, is a Nigerian oil company and majority interest holder of Block OPL230 offshore Nigeria. Brass Exploration Unlimited, Lagos, is a wholly owned subsidiary of Baker Hughes E&P Solutions, Houston, and technical partner to Moni Pulo on Block OPL230.
Baker Hughes E&P Solutions is a division of Baker Hughes Inc., Houston. RST Projects Ltd., Edinburgh, specializes in pipeline inspection and gauging.
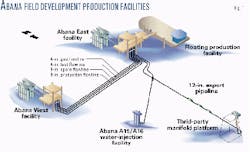
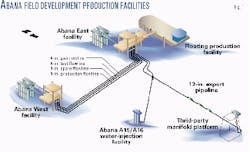
Development of the Abana field on Block OPL230 offshore Nigeria by Brass Exploration and Moni Pulo has oil exported from the western lobe of the field to the eastern lobe through two 8-in. flowlines. Oil is then exported from the process facility installed on the eastern lobe to a third-party manifold platform through a 40-km, 12-in. export pipeline.
In partnership with Moni Pulo, Brass Exploration is responsible for construction and operation of all field facilities, including in-field flowlines and export pipeline. Fig. 1 shows the layout of these lines.
The 12-in. pipeline and 8-in. flowlines have been in operation since March 1999. These lines are trenched subsea, and the seabed is covered in an unknown depth of silt for most of their length.
As a result, the operator has concerns as to whether these lines will be subject to excessive movement, particularly during the rainy season, when the currents are known to run very strongly. Currents vary from 3-4 knots in the spring to 8-10 knots during the rainy season.
Brass's requirement was to develop a strategy initially to benchmark the position of these lines and subsequently monitor them to ensure that required safety limits are not exceeded.
Existing technology
Two established technology options are widely used to perform post-lay surveys of newly laid subsea pipelines. Many pipeline operators will routinely employ a remotely operated vehicle (ROV) to benchmark a pipeline's vertical geometry at the time of construction. Such a vehicle is operated by a "pilot" from aboard a surface vessel.
The pilot flies the vehicle along the top of the pipeline, and the vehicle itself measures the depth of its location as it travels. As a result, any vertical changes in the pipeline lead to changes in the depth of the ROV, which are recorded.
The drawback with this approach is that significant problems are encountered when the line is buried or obscured by seabed deposits, such as the layer of silt known to exist in this case.
Mobilization and performance of such surveys are relatively expensive, and repeat surveys to confirm the stability of the line would show no cost saving over the first survey.
A second approach that can be used is to employ an inertial navigation, or three-dimensional (3D) pipeline-inspection vehicle ("pig") to measure the pipeline geometry profile as it passes through the line.
This technique had the potential to provide Brass Exploration with the information required. The inherent cost of using such a system, however, not only to provide an initial benchmark but also to monitor the lines over time, was deemed to be too great.
New technology
Major importance was placed by Brass Exploration not only on demonstrating that the pipelines had been successfully laid in the silt, but also that the subsequent exposure to ocean currents in an inherently unstable location was not permitting significant problems to evolve in service.
For this reason Brass Exploration effectively ruled out using the two aforementioned techniques and approached RST to see if a solution could be found using its SAAM technology in a tool that has been developed by RST over 31/2 years.
At the beginning of the development project, RST was aware that the behavior of utility (cleaning) pigs as they traveled down a pipeline could be characterized in certain ways. For example, among other things, they have a specific differential drive pressure, travel at a certain pitch in the pipeline (i.e., nose up or down), and vibrate in a certain way.
In addition, the SAAM development was based on the assumption that this pig behavior was directly affected both by the operational parameters of the pipeline it was passing through and by the nature of the conditions within the pipeline.
It was hypothesized by RST, that given that a pig's behavior is directly affected by the status of the pipeline it is passing through, recording a range of information about the pig's transit through the line had the potential to provide a "back-door" method of pipeline inspection.
By logging the output of a range of sensors mounted aboard a standard cleaning pig, it should be possible to record useful information regarding the condition of the pipeline. The successful interpretation of the data would provide a means by which to monitor the condition of pipelines more straightforwardly.
Hardware
The project therefore initially set out to develop an effective method for measuring and recording the behavior of a pipeline pig as it passes through a pipeline. The result of this project was SAAM, a miniaturized package of electronics: battery power supply, processor, solid-state memory, and an instrument stack.
The range of instruments carried varies according to the requirements of the job, but typically this will include means to measure temperature, pig differential drive pressure, vibration (split across five frequencies), acceleration, and inclination.
The package of electronics is housed within a stainless-steel casing pressure rated to 187.5 bar for the standard tools. This can be up-rated if required for the inspection of specific lines operating at higher pressures.
This unit (the SAAM) is then in turn normally retrofitted within the main body of a standard cleaning pig and thus measures its behavior as it travels down a pipeline.
When deployed in smaller-diameter pipelines (ID smaller than 12 in.), RST designs custom pigs to ensure that there is enough space for the SAAM unit to be fitted entirely within the pig body.
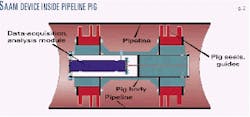
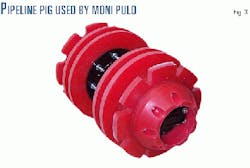
Fig. 2 shows a SAAM unit fitted within a typical pig. It is interesting to note that the SAAM is housed entirely within the pig body. Fig. 3 is a photograph of the pig supplied to Brass Exploration before it was used to survey the 12-in. line. The SAAM unit is not visible in the photo because it is hidden within the pig.
The hardware, however, only provides a platform from which to acquire the data from the onboard instrumentation that constitutes the pipeline survey.
In themselves, the raw data from any one of the instruments can only provide a very simple view of events inside the pipeline. It is the ability to superimpose information from a number of different instruments that provides SAAM with its capability.
Software
In tandem with the development of the SAAM hardware, time was spent assessing the various methods available by which large amounts of data can be successfully interpreted.
RST considers the analysis and interpretation of pig behavior to be the real key to the success of SAAM technology. Acquiring and recording the data is seen as purely a relatively simple engineering exercise, while interpreting it meaningfully requires sophisticated software analysis techniques and the benefit of many years of user experience.
Software tools to analyze the data were built in-house to facilitate the analysis, capturing both the signal processing necessary to extract the maximum information from the raw signals, and numerical calculations needed for the interpretation of the data.
The codes used are both able to handle the large amounts of data generated and flexible enough to allow RST to tailor it specifically for the particular application of analyzing SAAM data.
The tool underwent successful field trials in the North Sea in summer 1997, and from this date the increasingly large amount of real pipeline data generated has been used to construct a database of characteristic pig behaviors under a range of pipeline conditions.
From the start, one of the most encouraging aspects of the development exercise was how not only the obvious information on major features and components of inspected pipelines could be clearly identified, but the clarity with which much more subtle aspects of the pig's behavior appeared.
The two main aspects of the data gathered by SAAM that are of relevance to the problem of post-lay surveys of pipelines are the ability accurately to identify the pig's location in the pipeline and the recording of the pig's inclination in the line.
This combination of data allows an accurate estimation of the velocity of the pig on a local basis, and the integration of the inclination then leads to a calculated profile.
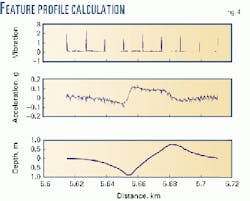
The data recorded by SAAM can thus be used to profile a pipeline's vertical geometry. There are three pieces of information required to do so. Fig. 4 details example data that are used, as well as the resultant profile of a particular feature, that is defined using the analysis software.
The initial information required is a measure of distance along the pipeline. This is achieved by detecting individual pipe-spool welds by recording the characteristic vibration effect each one has on the pig as it passes. Because one knows the length of each of the pipe spools, one can accurately position the pig within the line.
The second necessary piece of information is the speed of the pig. This can be obtained by a number of means, but the most accurate measurement of local pig speed can be obtained by using SAAM's onboard time-base to measure the period it takes for the pig to pass each pipe spool.
Generally speaking, the pipeline constructor or operator will know the mean length of each spool, but this can in any case be quite accurately estimated from knowledge of the total length of the pipeline and the total number of (full-length) pipe joints identified in the line.
The third and final piece of information required is a measure of the inclination of the pig. If a pipeline bends upwards or downwards at any point, as the pig passes this point its inclination will change accordingly. The inclinometer aboard SAAM is an effective instrument to measure such behavior.
First survey
The first survey of a pipeline in the system was of the 40-km, 12-in. export line during July 1999. The survey was successful, and RST has subsequently analyzed and benchmarked the pipeline using the data acquired.
A number of features and conditions were covered in the report, including overall pig behavior, individual pipe-spool fingerprints, in-line component fingerprints, significant anomalies, and most importantly pipeline geometry.
The pipeline's geometry has been successfully profiled along the length of the line. Specific areas of interest have been identified and focused on.
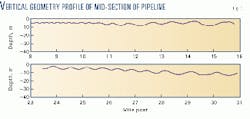
In the three regions of the pipeline where there are significant variations in pipeline depth, the pipeline appears in general to undulate in a regular wave-like manner. This is demonstrated in the strip map of the pipeline's geometry (Fig. 5).
The pipeline profile is borne out by the understanding of the seabed conditions. Where the pipeline appears to undulate, the seabed is believed to consist of varying amounts of soft silt. In particular, the regions where the pipeline undulates most are believed to be where the silt is at its deepest. Where the pipeline is level, the seabed is believed to be firm.
The survey has provided Brass Exploration with an as-laid baseline of the pipeline. This can be used as a comparison to future surveys, allowing changes to be measured and monitored.
The authors-
David Russell is technical director of RST Projects, a company he helped found in 1994, based in Musselburgh, UK. He has been involved in the modeling and analysis of fluid flow in pipeline systems including multiphase flow and transient behavior for more than 10 years, following his graduation from Heriot-Watt University, Edinburgh, with a BSc in physics.
Patrick Ogunjimi is a staff engineer with Baker Hughes E&P Solutions, Isleworth, Middlesex, UK, where he has worked for more than 3 years. His most recent role was as a member of the project management team responsible for the design, fabrication, and installation of the Abana field (OPL230, Nigeria) surface facilities.
Ogunjimi holds a BS in chemical engineering from University of Lagos and an MEng in petroleum engineering from Heriot-Watt University.
