Equations correct centrifugal pump curves for viscosity
Equations that replace diagrams can correct centrifugal-pump performance curves for highly viscous liquid.
These equations are based on a widely used and generally accepted procedure of the Hydraulic Institute, Parsippany, NJ. Its previously published charts, after digitizing, were fitted with analytical functions to derive the relevant parameters.
The model described in this article lends itself to computer applications and may be included as a subroutine in many kinds of software programs that involve selecting or evaluating centrifugal pumps.
Two examples prove that the proposed analytical model has good accuracy.
Pump curves
The proper selection and evaluation of centrifugal pumps rely on pump-performance curves supplied by the manufacturer. These curves illustrate the variation of pumping head, pump efficiency, and pump power vs. pump capacity.
For an ideal, frictionless liquid, performance curves would be straight lines and could be determined easily. Their shape, however, changes considerably if real liquids are pumped because the shape is affected by frictional and form-drag losses.
It is impossible to determine a given pump's performance curves by calculations because many design and manufacturing parameters (blade angle, gap width, surface roughness, etc.) affect these losses. Centrifugal-pump performance curves, therefore, are always established experimentally by actual measurement, with water as a conventional test liquid.
Performance curves provide realistic values when the liquid has a viscosity that is about the same as water (1 cst). In many cases, however, the liquid pumped (such as heavier crudes, etc.) may be more viscous. In these cases, pump performance considerably changes from that shown by the curves.
Viscous liquids cause more hydraulic losses in the pump, so that at greater viscosities, pumping head and pump efficiency decrease while required power increases. The pumping head and pump-efficiency curves valid for the viscous liquids fall below the corresponding water-performance curves, while the shut-off head point remains the same, regardless of viscosity.
Correcting pump curves
Three models available for correcting performance curves for viscosity are: Stepanoff, Paciga, and Hydraulic Institute models.
The theory of the centrifugal pump's hydraulic performance indicates that at the best efficiency point (b.e.p.), such as pump capacity at the greatest pump efficiency, only frictional losses are present. One can neglect form-drag losses, therefore.
Friction losses, however, analogously with pipe flow, are known to vary with Reynolds number and wall roughness. Because the Reynolds number includes the viscosity of the liquid pumped, the b.e.p. enables one to correct the head and efficiency values obtained from tests with water to other liquids with different viscosities.
Stepanoff model
Stepanoff performed several experiments with conventional centrifugal pumps made by Ingersoll-Rand.1 The tests included water as well as 11 types of oils with viscosities between 1 and 2,020 cst. Based on the experimental results, Stepanoff produced a diagram for the head correction factor and efficiency that is valid at the b.e.p.
The independent variable in the diagram is a Reynolds number-like parameter (Equation 1 in equation box).
The calculations first involve correcting the pumping head at the b.e.p., HWbep, to obtain the new value, HObep, for the viscous liquid. The HObep is then plotted at a pump capacity, QObep, found from Equation 2.
The pump's new head curve, plotted by hand, uses the point just calculated and the original shut-off head value as a starting point. The pump power curve is then drawn through the corrected power calculated for the b.e.p. by following the general slope of the original curve valid for water.
In the final step, one determines the corrected efficiency curve from the new power and head curves.
The Stepanoff correction diagram applies for a maximum Reynolds number of RStepanoff = 4 * 105.
Paciga model
The Paciga model is also based on a slightly modified Reynolds number-like parameter (Equation 3).2
Paciga provided correction factors for all performance curves and used two correlating parameters: the pump's specific speed, ns (Equation 4) and the ratio QW/QWbep, belonging to any arbitrary point on the performance curve for water.
From Paciga's diagram, capacity, head, and pump power correction factors for any flow rate can be calculated.
This model applies to Reynolds numbers in the range:
RPaciga = 4 * 107 to 4 * 109
Hydraulic Institute model
The Hydraulic Institute model involves two diagrams for correcting liquid viscosity.3 The first employs the capacity (pumping rate) QWbep at the b.e.p. of the water performance curves. This is an independent variable instead of a Reynolds number-like value.
The diagram's parameters are the pumping head at b.e.p. HWbep , and the kinematic viscosity, vo, of the liquid pumped.
Based on these values, one obtains from the diagram a rate Q* (a correlation parameter only). This parameter serves as the independent variable in the second diagram from which CH, CQ, and Ch are determined. CH, CQ, and Ch are the correction factors for the head, capacity, and efficiency curves, respectively.Four different CH values are needed to obtain several points on the most important performance curve, which is the pumping head-vs.-pump capacity curve. The factors are for the following four different capacities: 0.6QWbep, 0.8QWbep, 1.0QWbep, and 1.2 QWbep.
The correction factors for pump capacity and efficiency are independent of the water rate.
One can easily plot the corrected performance curves, valid for the more viscous liquid, from the calculated heads and efficiencies as a function of the corrected pump capacities. Accuracy is ensured by the fact that four different points on each performance curve are known. Also, the head-vs.-capacity curve has an additional set point that corresponds to the shut-off head at zero pumping rate. The shut-off head of all centrifugal pump remains the same irrespectively of the viscosity of the liquid pumped.
The Hydraulic Institute diagrams are valid for a pump capacity of 100-10,000 gpm and a pumping head of 6-600 ft. Also, the pump must have a conventional design and the kinematic viscosity of the liquid pumped should range between 4 and 3,000 cst.
Proposed model
A common feature of the methods previously discussed is the correction diagrams. Their application involves visually obtaining values and doing hand calculations, an anachronism in the era of high-speed computers.
Because running experiments are prohibitively expensive, the numerical calculations developed by the authors are based on one of the existing models.
A critical evaluation of the previous correction methods indicated the following:
- The Stepanoff model was usable only around the b.e.p. because determination of the pumping head curve between the shut-off head value and the b.e.p. is prone to human error.
- The Paciga method, on the other hand, enables one to establish complete performance curves, but its viscosity range is inappropriate for the high-viscosity oils and liquids commonly encountered in the petroleum industry. More-viscous liquids easily can reduce the actual Reynolds number to less than the lower limit (4 * 107) of the Paciga correlation.
- The authors selected the Hydraulic Institute method because of its broad application range and its more detailed results.
For converting the original, time-consuming hand procedure to an easy-to-use numeric one, the work involved digitizing the original charts and performing a regression analysis on the data. The individual curves on each chart were curve-fitted to find their most accurate approximating functions.
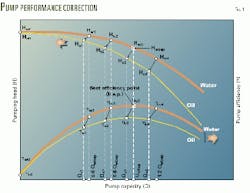
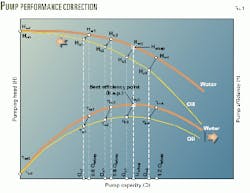
Fig. 1 shows the essential curves and points required for performance-curve correction.
The equations developed, of course, allow hand calculations, but the preferred method is to use a small computer program. This approach eliminates the need for visually reading several points on the original performance curves, which could introduce inaccuracy.
The authors, therefore, suggest the use of a digitizer to read several points on the original pumping head and efficiency-vs.-pumping capacity curves and to fit those with the power series of the pumping capacity. Experience shows that a third and a second-order series give sufficient accuracy for the head-vs.-capacity and efficiency-vs.-capacity curves.
The following discussion assumes that these curves have been digitized.
For the new method, the first step involves the determination of the pumping head and efficiency values valid at the pump's b.e.p., which is the pump capacity at its highest efficiency. One determines the points corresponding to QWbep after determining the maximum of the efficiency-vs.-pump capacity curve. This involves simple calculations if the performance curves were previously fitted with a power series, as discussed previously.
The correlation parameter Q* of the first Hydraulic Institute diagram can be calculated from the viscosity of the liquid being pumped and pumping head and capacity at the b.e.p.
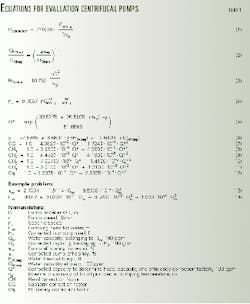
Curve-fitting of that diagram results in Equation 5, where y is defined by Equation 6.
As discussed previously, all the required correction factors are functions of Q*. Because of this, all curves on the second diagram of the original model could be fitted easily as functions of Q*.
The next steps involve determining several points on the new pumping head and pump efficiency curves. As also discussed previously, these are calculated for several different pump capacities to facilitate creation of a wide range of corrected data. For this purpose, four points on the original performance curves are determined, at the following pumping capacities: 0.6QWbep, 0.8QWbep, QWbep; and 1.2QWbep.
The corresponding corrected Qo capacities then can be found by simply multiplying the water capacity values by the capacity correction factor CQ (Equation 7).
One calculates the new pumping head values, hoi, by multiplying the hwi values of the water head curve and the appropriate CHi head correction factors. As discussed previously, head correction factors are different for the four capacities. Regression analysis resulted in Equations 8-11.Finally, one finds the corrected pump efficiency values, Hoi, by multiplying the original efficiencies Hwi by an efficiency correction factor, Ch. This was fitted by Equation 12.The procedure obtains four points on each of the new pump performance curves. In addition to these, a fifth point can be found easily, based on the hydraulic theory of centrifugal pumps.
According to those principles, the value of the shut-off head is independent of the viscosity of the liquid pumped. The new head Ho0, therefore, at zero pump capacity falls on Hw0 of the original curve. Likewise, pump efficiency h at zero pumping capacity must be zero in both cases, so that ho0 = hw0.At the end of the calculation process, there are five points available on each new curve and the corrected pump performance curves can be drawn with sufficient accuracy.
A more preferred solution, however, and the one suggested by the authors, fits the calculated data points with the power series of the pump capacity. The functions thus determined enable one to find pumping head and efficiency values at any pump capacity.
As indicated previously, the entire calculation model easily lends itself to computer programming and may be used as a subroutine in many kinds of program packages that involve selection or evaluation of centrifugal pumps.
The use of such a subroutine will ease the practicing engineer's work when selecting ESP units, designing crude oil pipelines, etc.
Example problem
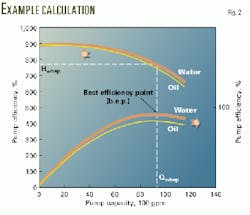
Fig. 2 depicts the performance curves of a centrifugal pump, as supplied by the manufacturer. For this example, the model will be used to find the pump performance curves when handling a liquid with a 55-cst viscosity.
In the first step, one fits the original curves with a power series of pumping capacity (Equations 13 and 14).
Then to find the b.e.p. of the given pump, one sets to zero the first differential of the efficiency function. From this, the pump capacity at b.e.p. is QWbep = 9,212 gpm. Using this value, one determines the original head at the b.e.p. from Equation 13 as HWbep = 770 ft.
To calculate the correction factors, one first finds the correlation parameter, Q* from Equation 5 as follows: y = 94.7 and Q* = 2,698 gpm
Then from Equations 8-11, the head correction factors are as follows: CH1 = 0.9898, CH2 = 0.9870, CH3 = 0.9810, and CH4 = 0.9758.
Equations 7 and 10 determine the capacity and efficiency correction factors as follows: CQ = 0.9879, and Ch = 0.9129.One obtains the four capacities of 0.6QWbep, 0.8Q, QWbep, and 1.2QWbep from the original pumping head and efficiency.
Because one already knows the correction factors, the coordinates of the new performance curves are easily calculated (Table 1), as follows:
- New capacities- Qoi = QwiCQ
- New heads- Hoi = HwiCHi
- New efficiencies- Hoi = Hwi Ch
Fig. 2 shows the corrected pump performance curves. The figure displays the best-fit power series for the two curves-second order for efficiency and third order for pumping head.
Accuracy
Two cases indicate the accuracy of the proposed model. Both involve measured performance curves of pipeline pumps handling higher viscosity oils.
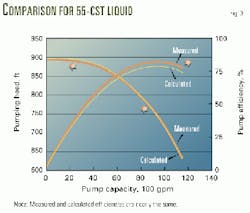
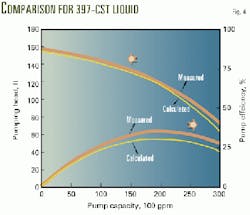
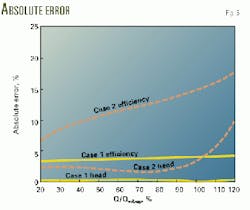
Figs. 3 and 4 show measured and calculated performance curves for 55 cst and 397 cst liquids, respectively. Fig. 5 indicates the calculated accuracy of the curves by plotting absolute errors of head and efficiency calculations vs. relative capacities Q/QWbep. The model is supposed to be valid for the relative capacity range of 20-120%.
Errors in pumping head calculations are less than 2.5% for pumping capacity less than 100%. Above 100% the error increases. For Case 2, with the more viscous liquid, the accuracy is slightly greater.
Pump efficiency errors are greater but are still less than 4% for Case 1. Case 2 with the more viscous oil, has a greater error.
A general observation for both parameters is that calculation accuracy slightly increases with an increase in pumping capacity.
Acknowledgment
The authors gratefully acknowledge the financial support from the National Scientific Research Foundation, Hungary, in funding the project OTKA 24157.
References
Zoltan Turzo is an assistant professor in the petroleum-engineering department of Miskolc University, Hungary. His expertise includes artificial lift, pipeline hydraulics, computational fluid dynamics, and software development for production system analysis and pipeline networking applications.
Turzo has an MS in petroleum engineering.
Gabor Takacs heads the petroleum engineering department of Miskolc University, Hungary. His main expertise is production engineering and artificial lift problems. Takacs has been a visiting professor at Texas Tech University, Lubbock, Tex., and the Mining University, Leoben, Austria. He holds MS and PhD degrees in petroleum engineering.
Janos Zsuga heads the dispatching center of MOL Ltd. His expertise includes pipeline transportation and logistics. Zsuga has an MS in petroleum engineering.
Based on a presentation to the 47th Southwestern Petroleum Short Course, Lubbock, Tex., Apr. 12-13, 2000.
