Special Report: Midyear Forecast: US energy demand growth slows on economic sluggishness
Marilyn Radler
Senior Editor-Economics
Laura Bell
Statistics Editor
Total energy demand in the US this year will increase marginally from 2010, weighed down by the sluggish economy and high oil prices.
Buoyed by low prices, natural gas demand will rise more than demand for oil, while coal and nuclear demand will decline slightly from last year's levels. US demand for hydroelectric power, wind, and other renewable energy sources will post the largest percentage growth this year.
US production of oil and gas will increase this year due to continued development of unconventional resources. Meanwhile, global oil demand growth will slow from a year ago, and supplies will increase by 1.5 million b/d.
Worldwide oil demand
Strong demand for oil in developing countries will result in worldwide oil demand climbing by 1.3 million b/d to 89.3 million b/d this year, according to the latest forecast from the International Energy Agency. In 2010, global oil demand increased by 2.7 million b/d.
Oil demand in the developed countries of the Organization for Economic Cooperation and Development will contract by 200,000 b/d from last year to average 45.9 million b/d. IEA expects marginal reductions in demand in North America and OECD Europe, as high prices and economic weakness drive efficiency improvements.
Outside the OECD, the agency projects that demand will be unchanged from 2010 in the former Soviet Union (FSU), non-OECD Europe, and Africa. Oil demand in China will surge to 9.7 million b/d this year from 9.1 million b/d, buoyed not only by the country's economic growth but also by an increase in demand for gas oil in light of widespread power outages.
Meanwhile, other Asian non-OECD demand will climb by 400,000 b/d to average 10.8 million b/d this year. Elsewhere outside the OECD, IEA forecasts small increases in demand in Latin America and the Middle East.
IEA noted in its May Oil Market Report that governments in Russia, Brazil, and China face difficulties fully passing on recent price rises to consumers, helping to sustain robust demand growth in the non-OECD countries.
Global oil supply
With oil production in Libya sharply curtailed in the wake of civil war, the remaining members of the Organization of Petroleum Exporting Countries will need to accelerate output growth to help meet projected worldwide demand this year.
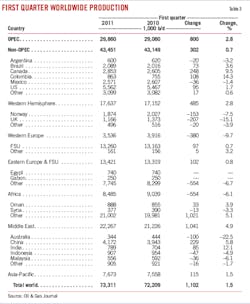
Total non-OPEC oil supply will average 53.3 million b/d, IEA forecasts, up from 2010 average supply of 52.7 million b/d. OECD supply in total will be unchanged at 18.9 million b/d, as North American output inches upward and OECD Europe supply contracts by an equal amount. OECD Asian oil supply is forecast to hold at 600,000 b/d.
Non-OECD oil supply will climb this year to average 30.3 million b/d from last year's 29.9 million b/d, led by output gains in Latin America, notably in Brazil. The FSU and China will post small increases in output.
The most recent OPEC ministerial meeting, held in Vienna last month, failed to reach a new agreement of output levels for its members, despite the market's loss of Libya's light crude oil and Saudi Arabia's concerns about high prices for Brent crude oil. With no OPEC agreement to raise oil output, Saudi Arabia promised to add supply to the market unilaterally.
Libyan oil output averaged an estimated 450,000 b/d in March, down from 1.39 million b/d in February and 1.58 million b/d in January.
The Centre for Global Energy Studies (CGES), London, said after the June 8 meeting, "By consistently failing to take action, even when there is compelling evidence that it needs to do so, OPEC is making itself irrelevant as a force for stability in the oil market."
The Saudis clearly saw the need for a formal output increase and even threatened to go it alone if it could not get agreement at the meeting, CGES said, adding that oil markets will now have to wait and see whether Saudi Arabia lives up to that promise in the months ahead.
CGES assessed OPEC's spare production capacity in May at 4.75 million b/d, with 3.25 million b/d of this in Saudi Arabia.
OPEC supply of natural gas liquids will average 5.9 million b/d this year, IEA estimates. This portion of OPEC output, which is not subject to the organization's production agreements, continues to climb and averaged 5.3 million b/d last year.
OPEC crude supply averaged 29.9 million b/d in this year's first quarter, according to IEA. Following a second-quarter dip to 29.2 million b/d, OGJ estimates that the organization's output will climb to average 30 million b/d in this year's second half. This will result in worldwide supply averaging 89 million b/d for the year and an annual stockdraw of 300,000 b/d.
US economy
Modest economic growth in the US this year faces some strong headwinds, according to the Conference Board's Leading Economic Index released in June. The board's LEI climbed by 0.8% in May after declining by 0.4% in April, as the index gained on the interest rate spread, consumer expectations, and housing permits.
However, high gasoline and food prices and a soft housing market will likely result in choppy economic growth through the summer and fall, the Conference Board said.
Recent reports also have indicated that consumer sentiment about the health of the economy has declined since May, which is likely to result in continued sluggishness in consumer spending beyond food and gasoline.
Falling gasoline prices will temper this negative sentiment if they continue to decline, but high unemployment, concerns about the national debt and health-care costs, and persistent problems in the housing market will continue to weigh on economic growth.
OGJ forecasts that gross domestic product in the US will increase by 2% this year, as high unemployment, registering at 9.1% in May, and strong consumer prices hold short-term economic growth in check. The latest projections from the Federal Reserve Board put the unemployment rate at the end of this year at 8.6-8.9%; at the end of 2012, the board forecasts unemployment at about 8%.
The US Bureau of Economic Analysis reported that GDP climbed at a rate of 1.9%/year in this year's first quarter, following 3.1% growth in fourth-quarter 2010.
Last year's economic turnaround saw GDP grow by 2.9%, rebounding from the 2009 contraction of 2.6%.
Energy use by source
Most major energy sources will incur small changes in demand this year as total US energy demand climbs by nearly 1%. Energy efficiency will improve to 7,300 btu/$ of GDP from 7,400 btu/$ of GDP last year.
This contrasts with last year's 3.7% overall energy demand growth, in which natural gas, coal, and renewable energy each grew by nearly 6% from a year earlier. Demand for oil and nuclear energy during 2010 increased by 1.6% and 1% respectively.
OGJ forecasts that with 36.15 quadrillion btu (quads) of product supplied, oil will meet 36.6% of total 2011 US energy demand. This will be a 0.5% boost in demand from a year ago, when oil demand climbed 1.6%.
Feeble demand growth for transportation fuels in light of high prices and the still-sluggish economy and high unemployment are limiting oil demand growth this year.
Demand for gas will climb to 24.89 quads from 24.64 quads last year, getting a small boost from low prices in electric power generation and an increase in industrial demand.
Oil and gas combined will meet 61.8% of the US energy market demand this year, the same share that it met last year, although oil's share will decline by 0.1 of a percentage point and gas' share will increase by the same amount.
Coal demand will contract this year by 1% due to competition from other fuels and flat power demand. Last year coal use for electric generation climbed 5.7% in the US on stronger summer electricity demand.
Nuclear energy use will decline marginally to 8.43 quads from last year's 8.44 quads, while demand for hydroelectric power and all other renewable energy sources will soar by 5.8% to 8.6 quads this year.
Hydroelectric power generation fell a bit during 2010; still, total renewable energy consumption climbed by almost 6% from a year earlier.
The use of biomass, which comprises the majority of renewable energy consumption in the US, jumped to 4.3 quads last year from a 2009 total of 3.9 quads. Wind energy use during 2010 climbed to 0.9 quads from 0.7 quads.
Oil prices
OGJ forecasts that the US wellhead price of crude this year will average $92/bbl compared with last year's $74.71/bbl.
Plentiful oil inventories at Cushing and a tight market for light crude in Europe pushed the price of Brent crude above the price of West Texas Intermediate last year. In this year's first quarter, Brent spot prices averaged $104.96/bbl, while WTI averaged $93.54/bbl. Spot prices surged in April, with Brent averaging $123.26/bbl, before prices began to fall due to slowing economic growth.
Product prices also will post higher averages vs. a year ago. All types of retail motor gasoline will average $3.48/gal, up from last year's $2.836/gal. The pump price peaked in May following this spring's high crude oil prices, averaging about $4/gal that month.
The average refiner acquisition cost of domestic and imported crude climbed to $109.72/bbl in April from $102.50/bbl in March and $90.85/bbl in February, according to the US Energy Information Administration. OGJ forecasts that for 2011, the refiner acquisition cost of crude will average $93/bbl.
Residential heating oil, excluding tax, will average $3.40/gal compared with last year's $2.798/gal.
Gasoline, distillate, jet fuel
Moderating pump prices will keep gasoline demand from sinking too much this year, as OGJ forecasts that 2011 demand for the fuel will average 9.03 million b/d. This falls just slightly below last year's average of 9.034 million b/d as a result of persistent high unemployment and strong pump prices.
In this year's first half, demand is estimated to have been 0.3% lower than during the first half of 2010. Gasoline demand fell 1.3% in January as compared with a year earlier, then it was flat in February. In March, gasoline demand climbed 1.7% from a year earlier before declining again during the second quarter.
US demand for distillate fuel oil, meanwhile, will increase 1.5% from last year, averaging 3.85 million b/d this year. Strength in demand by industrial and transportation customers will drive this increase, as so far this year, demand by commercial and residential users has declined from a year ago.
Jet fuel demand will be little changed from 2010, averaging 1.42 million b/d, while business travel continues apace and consolidation among airlines has resulted in fewer but fuller flights. Consumers remain cautious about discretionary spending for vacations, but strong gasoline prices are directing some travelers toward air travel vs. travel by car.
In its annual summer air travel forecast, the Air Transport Association of America (ATAA), the industry trade association for leading US-based airlines, predicts that US airlines will carry a total of 206.2 million passengers from June through August, about 1.5% more passengers than during the corresponding 2010 period.
Passenger volumes have not recovered from their pre-recession levels of summer 2008 and remain well below the summer 2007 all-time high of 217.6 million, ATAA reported.
LPG, other products
At 2.2%, demand growth for liquefied petroleum gases, including propane and propylene, will moderate from last year's 5.5% jump, averaging 2.15 million b/d this year. Petrochemical plant demand for feedstocks has pushed up demand for LPG since the second half of 2009 with economic recovery and in a market with greater supplies of LPG.
Demand for all other petroleum products, including petroleum coke, lubricants, asphalt, and others, will rebound to average 2.26 million b/d after dipping slightly last year to 2.22 million b/d.
US oil supply
US oil production will be little changed from last year. A jump in crude and condensate production from onshore US operations resulting from additional drilling in liquids-rich plays will only slightly outweigh declines in production from Alaska and the Gulf of Mexico.
OGJ forecasts that crude and condensate production will average 5.52 million b/d, up from last year's 5.512 million b/d. Natural gas liquids output will climb 0.4% to 2.01 million b/d.
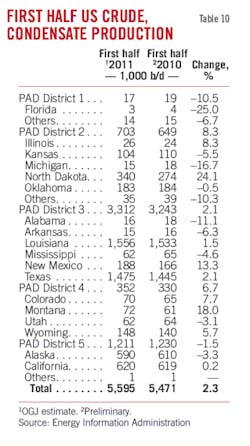
In the first half of 2011, US crude and condensate production averaged 5.595 million b/d, OGJ estimates. This was an increase from 5.472 million b/d in 2010's first half.
Alaska's oil production declined to 590,000 b/d in the first 6 months of this year from 610,000 b/d a year earlier. For all of 2010, oil production in Alaska averaged an estimated 599,000 b/d, down from the 2009 average of 645,000 b/d.
Production in North Dakota, spurred by heightened activity in the Bakken shale, jumped to average 340,000 b/d in this year's first half from 274,000 in the 2010 first half. Colorado, Montana, and Wyoming also posted production gains, as did Louisiana, New Mexico, and Texas.
Plant production of renewable fuels and oxygenates, including fuel ethanol and biodiesel, will average 1.01 million b/d, up from last year's 902,000 b/d.
Imports, exports
This year the US will import almost 2% less crude oil and products than it did during 2010, while exports will decline by almost 3%.
Crude oil imports, excluding any for the Strategic Petroleum Reserve, will average 9 million b/d, compared with 9.16 million b/d last year. No crude has been imported for the SPR since 2009, according to EIA.
Product imports will slide to 2.54 million b/d from last year's 2.59 million b/d. Total imports will satisfy 60% of US demand this year vs. 61.4% last year.
The source of the most US oil imports last year was Canada, followed by Mexico, Saudi Arabia, Nigeria, and Venezuela.
Meanwhile, US exports of crude and products will average 2.25 million b/d, such that net imports meet 48.3% of US demand. A year ago net imports met 49.3% of US oil demand.
Product exports have received a boost, especially in late 2010 and early this year, from strong gasoline demand in Latin America.
Oil inventories
OGJ's forecast assumes that commercial inventories of oil at yearend 2011 will be unchanged from a year earlier. During 2010, such stocks climbed by 48,000 b/d.
Stocks of crude oil in the SPR at the end of 2010 held 727 million bbl and had not changed until plans for a 30 million bbl release were announced at the end of June.
This US stock release is part of a 60 million bbl release coordinated by IEA in response to the disruption in oil supplies from Libya, estimated to have removed 132 million bbl of light, sweet crude from the market by the end of May.
IEA member countries hold more than 4.1 billion bbl in total oil stocks, and nearly 1.6 billion bbl of this total are held for emergencies.
Commercial stocks of crude in the US finished last year at 332 million bbl, up from 325 million bbl at yearend 2009.
At the end of this year's first half, commercial crude oil stocks stood at about 360 million bbl.
Product stocks, meanwhile, stood at an estimated 720 million bbl at the end of last month, down from 735 million bbl at the end of last year and 749 million bbl at the end of June 2010.
Refining
Despite strength during this year's first half as compared with the same period in 2010, total refinery activity will decline this year, dragged down by especially weak activity on the US East Coast. Meanwhile, total operable capacity at US refineries will climb marginally. This will drive 2011 capacity utilization to 83.4%, down from last year's 86.2%.
Despite high utilization in PADD 2—especially at the Midwest refineries in Minnesota, Wisconsin, and North Dakota—total US refinery capacity utilization dropped to average 79.8% in Feb 2011, down from 84.9% a month earlier. Utilization then rebounded in March to 84%.
OGJ forecasts that operable capacity at all US refineries will end this year at 17.7 million b/d, up from 17.59 million b/d at yearend 2010.
Cash refining margins in the first 5 months of this year were especially weak for US East Coast refiners but relatively healthy in other refining regions, according to the most recent data available from Muse, Stancil & Co.
The average US East Coast cash margin was negative in March and April, and then it turned positive in May to average $1.26/bbl. The Gulf Coast margin averaged $6.38/bbl in the first quarter before climbing to $8.14/bbl in April and $9.59/bbl in May.
The highest cash margin this year has been in the US Midwest, where the margin averaged $26.48/bbl in May following a first-quarter average of $15.65/bbl and $18.07/bbl in April.
Natural gas market
Gas demand will increase this year, but it will not keep pace with US gas production growth.
Demand will climb 1% to 24.385 tcf following last year's nearly 6% surge in demand that was prompted by a rebound in industrial demand, and to a smaller extent in residential and commercial demand, after the economic slump put a dent in demand in 2009.
Gas exports will decline from last year, and inventories will close 2011 up from yearend 2010 levels.
Fueled by production in shale plays, marketed production of gas will climb 5% this year to 23.765 tcf. Although gas production in the federal waters of the Gulf of Mexico will decline 9% from last year, production growth elsewhere, especially in Louisiana, will drive output higher. Output from the Marcellus shale will contribute to a large portion of 2011 production growth.
OGJ forecasts that barring any major interruptions by tropical storms, production will climb by 35% in Louisiana amid delayed completions and lower rig counts. Gas production growth in Texas will flatten to 2% this year, as drilling shifts in favor of liquids.
US imports of LNG are on track to total 400 bcf, down from 431 bcf last year. Low demand and prices are directing cargoes to Asia, where demand in Japan has swelled following the natural disasters that resulted in the loss of nuclear power there.
Gas imports from Canada and Mexico will slide this year, as both of these countries require more of their own gas. This year, 2.98 tcf of gas from Canada will reach the US market, a 9% decline from last year, while gas imported from Mexico falls to 5 bcf from 30 bcf a year ago.
The US market will see a storage injection of 200 bcf this year, despite slightly stronger demand spurred by power generation. Coal and gas prices are near parity for power generation, allowing for fuel switching to gas from coal where feasible.
Gas prices are expected to remain low throughout 2011, as OGJ forecasts an average wellhead price of $4.10/Mcf for the year. This compares with last year's $4.16/Mcf average.
More Oil & Gas Journal Current Issue Articles
More Oil & Gas Journal Archives Issue Articles
View Oil and Gas Articles on PennEnergy.com
