Evaluating claims of groundwater contamination from hydraulic fracturing
Tarek Saba
Exponent Inc.
Maynard, Mass.
Proper evaluation of a claim of groundwater contamination from hydraulic fracturing requires several steps, which include characterization of the background groundwater condition, the environmental condition of the area around the water wells, and the chemicals associated with the fracturing process.
This characterization enables the use of multiple analytic tools to trace source or sources of compounds detected in the groundwater. Example analyses include comparing the groundwater compound concentrations with background and conducting chemical fate-and-transport and fingerprinting.
Using multiple lines of analytical evidence can ultimately lead to an accurate conclusion regarding the condition of the groundwater and the sources of compounds in it. With this information, investigators can assess the validity of a groundwater contamination claim.
This article reviews the steps generally followed to assess sources of compounds in a drinking-water well. The article provides some examples of relevant circumstances based on the author's review of information from groundwater contamination claims in Pennsylvania.
Stray gases
The natural presence of stray gases in drinking-water wells and in rivers and streams in some areas of the US is not a recent phenomenon, as anecdotes from long-time residents have confirmed.1 In addition to such references, historical US Geological Survey studies documented the presence of methane in Pennsylvania aquifers before development of the Marcellus shale.2
More recently, researchers have conducted large-scale studies to characterize the presence and concentrations of stray gases in drinking-water wells. A study of 1,700 water wells in Susquehanna County found dissolved methane to be ubiquitous in lowland valley groundwater wells, with detectable methane concentrations in more than 78% of these wells.3 This finding underscores the importance of determining the presence of stray gases in the area of interest before drawing conclusions about the origin of gases in a drinking-water well.
Chemistry
Information from residents about the condition of local groundwater before fracturing could be revealing. For example, in northeastern Pennsylvania, in the 1940s and 1950s, one resident described her well water quality as having "lots of iron in it."4 This information would be critical to determining the baseline condition of groundwater.
Analytical data are often unavailable or insufficient to characterize background groundwater quality. The need for additional background data led to the initiation of major study programs. For example, one such study included 11,262 baseline water samples from northeastern Pennsylvania water wells.5 It found that many compounds (arsenic, iron, manganese, lead) occur at background concentrations that exceed secondary maximum contaminant levels (MCLs), as defined by the US Environmental Protection Agency (EPA).
The importance of reviewing background groundwater-quality data, besides reconstructing the natural state of groundwater at a location, is realizing that constituents in water could naturally exceed their corresponding MCLs. As a result, one must compare water-well concentrations with background conditions to determine whether those concentrations warrant further investigation of a source.
In claims of water-well contamination, investigation of the environmental conditions in the area surrounding the well is important because it may provide information about potential sources of contamination. For example, many rural households burn trash in pits, create junk piles, have asphalted driveways, and have abandoned cars and septic tanks that may be leaking. Contaminants from these sources can leach out during rains and reach groundwater.
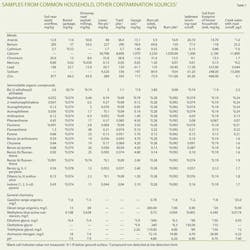
Table 1 presents analytical results from samples collected from burn pits and other potential household contamination sources. These samples frequently contained diesel-range organics, methylene blue active substances (MBAS), glycols, and polycyclic aromatic hydrocarbons (PAHs). Some studies cite these compounds as markers for fracturing operations.6 Table 1 shows that the mere presence of these compounds in a drinking-water well does not necessarily indicate a fracturing effect.
Chemicals in hydraulic fracturing
Identifying the chemicals used in fracturing provides a basis for comparison with the chemical profile of the water well being studied. Fig. 1 shows the classes and typical quantities of chemicals used in fracturing. In addition, an online registry (www.fracfocus.org) lists chemical disclosures for the fracturing fluids used at gas wells throughout the country. As of May 2013, this registry included information on more than 45,145 wells.
After fracturing, flowback of some of the injected fluids and shale brine water lasts for a few weeks.7 Recovered fracturing fluids typically constitute 5-50% of the flowback.7 The flowback composition changes with time, from the initial flowback of fracturing fluids to water with increasing salt content from the shale brines. Table 2 shows an example change in indicator chemical concentrations in flowback water for the first 30 days.
In addition to characterizing all potential contaminant sources, one must ensure that the drinking-water well was sampled properly.
Sampling wells
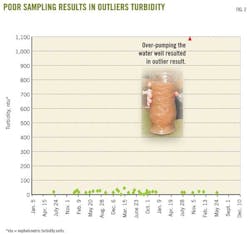
Proper water-well sampling is critical because poor sampling methods, such as overpumping, can result in excessive turbidity in the sample. Turbid water samples contain soil particulates suspended in the water, often with metals attached to them. As a result, excessive turbidity results in outlier (high) concentrations of metals that do not represent the groundwater condition.
Fig. 2 shows how poor sampling techniques could produce outlier results. In this figure, water samples were collected over 3 years from a drinking-water well, and turbidity was found to be less than 50 nephalometric turbidity units (ntu). During one sampling event, however, the well was overpumped, resulting in a visually turbid water sample and a turbidity of greater than 1,000 ntu.
Analytical results for that turbid sample showed outlier high metal concentrations, as warned by the Pennsylvania Department of Environmental Protection (PADEP) guidelines.8 If this well were suspected of having been affected by hydraulic fracturing, this poor sampling technique could produce a cloudy water sample, ostensibly containing high concentrations of certain metals, which could be misinterpreted as being affected by fracturing. Proper sampling technique to avoid such a misrepresentation should include presampling measurement of indicator parameters (e.g., pH, specific conductance, temperature, etc.), together with turbidity measurements, until these parameters have stabilized.9
Note that many rural drinking-water wells are completed in bedrock and do not include a casing or a filter. In such wells, poor sampling technique could quickly increase turbidity in the well, resulting in an artificial increase in the concentrations of naturally occurring compounds such as aluminum, iron, and manganese. For this reason, it is important to analyze both filtered and unfiltered water samples to determine which inorganic compounds are associated with soil particulates vs. those dissolved in the groundwater.
Lab analysis
For metals, both filtered and unfiltered water samples are typically analyzed. EPA adopted this approach to analyzing water samples collected from residential wells in Dimock, Pa.10 An analytical list generally includes volatile organic compounds (VOCs), semivolatile organic compounds (SVOCs), total and dissolved metals, ethylene glycol, acidity, alkalinity, total dissolved solids (TDS), chloride, pH, diesel and gasoline-range organics (DRO and GRO), MBAS, and total petroleum hydrocarbons (TPH). Coliform bacteria analysis may be important to determine it the sampled water well is affected by a nearby septic tank, runoff, or any other bacterial source.
It is also important to coordinate with the laboratory to make sure the analytical results are reliable. For example, the draft report of EPA sampling conducted in Pavilion, Wyo., highlighted that glycols were detected in domestic wells using gas chromatography with flame ionization detection (GCFID; EPA Standard Method 8015).6 Glycol analysis, however, using liquid chromatography with tandem mass spectroscopy (LC/MS/MS) failed to replicate these glycol detections. These contradictory analytical results could lead to misinterpretation of the groundwater data.
Natural gas isotope analysis
Some of the claims of groundwater impacts from fracturing indicate the presence of gases in drinking-water wells. Assessing the merit of these claims could use natural gas stable-isotope analysis for tracing the source of gases in the water wells in question to determine whether the gases occur naturally or result from fracturing.
Most elements (e.g., carbon) occur in nature as mixtures of stable-isotope forms. The ratio of one isotope to another varies according to the organic matter from which the gas is formed. The carbon 12 (12C) isotope is the most common form of carbon (99% of all carbon); the carbon atom has six neutrons. The 13C isotope (1% of all carbon) has one extra neutron (seven neutrons) and is therefore heavier than 12C. The ratio of 13C/12C can discriminate among natural gases from different sources.11-16
Stable-isotope data are expressed as the ratio (13C/12C) in a sample compared with a standard. For example, the stable carbon isotope of methane in a gas sample compared with a standard is calculated as shown in the equation in the accompanying (p. 81).
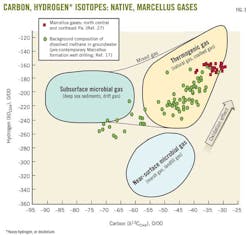
A plot of carbon (and hydrogen) isotopes for methane can indicate the origin of the gas sample (Fig. 3). There are two main types of gases—biogenic or thermogenic.
1. Biogenic gases include bacteria-produced methane (also known as "microbial gas"); microbial gases are associated with landfills and near-surface marsh gases.
2. Thermogenic gases include stray gases and shale gases.
Stray gases exhibit a wide range of isotopic fingerprints. Fig. 4, for example, presents stable isotopes for stray gases collected from Potter, Tioga, Bradford, and Chemung counties in northeastern Pennsylvania, together with northeastern Pennsylvania stray gases from the literature.17 The results are consistent with a study that characterized Appalachian basin native stray gases.14
Thermogenic Marcellus shale gases also have varying isotopic signatures (Fig. 4). Drinking-water wells containing thermogenic gas require additional investigations to determine whether the gases originated from shale gases or are naturally occurring stray gases. Acquiring multiple gas source samples will help in the source evaluation. Because the isotopic fingerprints of native stray gases and shale gases vary, the analysis should focus only on gases relevant to the study area, as opposed to isotopic data of source gases far from or not relevant to the area of interest.16
In addition to collecting source gases, obtaining stable-isotope data (carbon and hydrogen isotopes) for ethane and propane (in addition to methane) may help reveal the source of gases in a water well.16 For example, the carbon isotope composition of ethane (δ13CC2H6) is less affected by gas migration and thus approaches the carbon isotope composition of the source.14
A complete set of isotope data also enables a comparison of the carbon isotope value in methane (δ13CCH4) to that in ethane (δ13CC2H6). A gas sample is described as exhibiting a "reversal" when δ13CCH4 is less negative than δ13CC2H6. Depending on the gas sources, observation of reversal in gas samples can be used to infer the origin of the gas.17 18
Investigation methods
Once a drinking-water well has been sampled properly and the samples analyzed, several analysis tools can assess the water quality. Typically, multiple tools in the data analysis step provide multiple lines of evidence as to whether the drinking-water well is affected by an anthropogenic source or contains background compounds.
In addition to determining the compounds present in a water well, it is also important to determine which compounds are not present. For example, a water sample that contains naturally occurring inorganic (e.g., metals) compounds with no organic compounds suggests that these inorganic compounds may occur naturally, even at concentrations that exceed the secondary MCLs.
In other situations, organic compounds may occur in a residential water well, with a nearby fracturing operation as a suspected source. In these situations, investigators will need to determine the reliability of the laboratory data and replication of results. (For example, is the organic compound a common laboratory contaminant? Was the organic compound used in the fracturing operation? Is the organic compound found in multiple sampling rounds?)
In addition, fate and transport analysis (migration of contaminants in groundwater) and geochemical modeling (such as the USGS model PHREEQC)19 may be useful in determining the source.
Halogen compound analysis
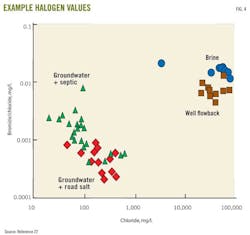
Compared with typical groundwater, shale waters are saline, with greater chloride and sodium concentrations, among other compounds (Table 1). Road salt and septic discharge of salts associated with water softeners could increase the salinity of surface water and groundwater.20
Distinguishing among these salinity sources may use the ratio of halogen elements.21 For example, the ratio of bromide-chloride to chloride can differentiate among background groundwater, groundwater affected by septic sources, and groundwater affected by road salt, flowback, and brine waters22 (Fig. 5).
PAH analysis
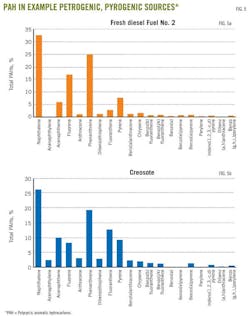
PAHs constitute a group of organic compounds with two or more fused benzene rings. Naphthalene, the simplest PAH compound, includes two fused benzene rings. PAHs occur in crude oil, petroleum products (diesel), and organic seams in subsurface soils.
They are also formed during rapid, high-temperature (>500° C.), incomplete or inefficient (i.e., oxygen-starved) combustion of organic biomass (i.e., pyrogenic).23 Pyrogenic sources containing PAHs include soot and creosote, among other sources. Fig. 6 shows PAH examples in creosote and diesel oil.
In groundwater contamination claims, a water well may contain PAH compounds (e.g., benzo(a)pyrene), and chemical fingerprinting analysis can trace the PAH source. For example, the ratio of two PAH compounds (fluoranthene:pyrene, or FL:PY) can provide information about the PAH source, whether petroleum-based (i.e., petrogenic) or pyrogenic.24 A fluoranthene:pyrene ratio greater than 1.0 indicates PAHs from a pyrogenic source such as soot, which could come from household activities (such as house chimney cleaning) or road runoff.
Dissolved isotope analysis
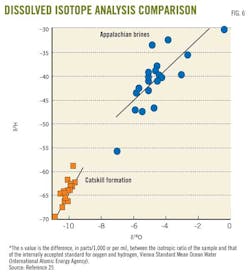
This analysis is based on the theory that stable isotopes for water (oxygen δ18O and hydrogen δ2H) and dissolved salt isotopes (e.g., boron 11B/10B, strontium 87Sr/86Sr, and radium 228Ra/226Ra) in shale waters, differ from those in shallow groundwater.
For example, some researchers have shown that the Marcellus shale has a 87Sr/86Sr value of 0.7115 and a δ11B value of (32 to 33‰). These values differ from shallow-groundwater isotope values of 0.71201–0.71553 for 87Sr/86Sr, and 13.1–28.1‰ for δ11B obtained from the Catskill formation in eastern Pennsylvania.25 Fig. 7 distinguishes between oxygen and hydrogen isotopes in Catskill formation shallow groundwater and Marcellus shale water.25 Isotope analysis alone cannot assess groundwater contamination; evaporation could enrich the isotopic composition of oxygen and hydrogen in groundwater.
Radionuclides are unstable elements that release radioactive particles (e.g., alpha or beta particles). EPA regulates radionuclides based on concentration (microgram/l.; µg/l.) and activity (picocurie/l.; pCi/l.), the latter of which is a measurement of how frequently a radioactive particle is released. (Picocurie, or pCi, is a standard measure of the intensity of radioactivity in a sample of radioactive material.)
The presence of elevated naturally occurring radioactive material (NORM) concentrations in the drinking-water well may be result from higher natural background radioactivity in certain locations.7 For Pennsylvania, the measured range of background levels in groundwater ranged from <0.1 to 167 pCi/l. for gross alpha, 0.6–270 pCi/l. for gross beta, and <0.6–172 pCi/l. for combined radium.26 These ranges contain background concentrations greater than EPA's MCLs of 15, 4, and 5 pCi/l. for gross alpha, beta, and combined radium, respectively. Therefore, one should compare NORM concentrations to background.
References
1. http://www.cabotog.com/pdfs/Tab1.pdf; accessed June 4, 2013
2. Lohman, S.W., "Groundwater in Northeastern Pennsylvania," Commonwealth of Pennsylvania Topographic and Geologic Survey Bull. W4, 1937 (reprinted 1957).
3. Molofsky, L.J., Connor, J.A., Farhat, S.K., Wylie, A.S. Jr., and Wagner, T., "Methane in Pennsylvania Water Wells Unrelated to Marcellus Shale Fracturing," OGJ, Dec. 5, 2011, p. 54.
4. http://peakoil.com/production/when-a-rig-moves-in-next-door, accessed June 4, 2013.
5. Perry, A.E., Bothun, R., Smith, B., and Hollingsworth, M., "The Occurrence of Methane in Shallow Groundwater from Extensive Pre-drill sampling," Groundwater Protection Council, Stray Gas Forum, Cleveland, July 24-26, 2012.
6. "Investigation of Groundwater Contamination near Pavillion, Wyoming" (draft), US Environmental Protection Agency, Office of Research and Development. National Risk Management Research Laboratory, Ada, Okla. EPA 600/R-00/000, December 2011.
7. King, G., "Hydraulic Fracturing 101: What Every Representative, Environmentalist, Regulator, Reporter, Investor, University Researcher, Neighbor, and Engineer Should Know about Estimating Frac Risk and Improving Frac Performance in Unconventional Gas and Oil Wells," SPE Hydraulic Fracturing Technology Conference, Feb. 6-8, 2012, The Woodlands, Tex.
8. "Groundwater Monitoring Guidance Manual," Pennsylvania Department of Environmental Protection, Dec. 1, 2001.
9. Nielsen, D.M., and Nielsen, G.L., "The Essential Handbook of Groundwater-Water Sampling," Boca Raton, Fla.: CRC Press, Taylor and Francis Group, 2007.
10. EPA in Pennsylvania, http://www2.epa.gov/aboutepa/epa-Pennsylvania; accessed May 2013.
11. Schoell, M., Stable Isotopes in Petroleum Research, in Advances in Petroleum Geochemistry, J. Brooks, Ed., London: Academic Press, 1984, pp. 215-245.
12. Jenden, P.D., Newell, K.D., Kaplan, I.R., and Watney, W.L., "Composition and Stable Isotope Geochemistry of Natural Gases from Kansas, Midcontinent, USA," Chemical Geology, Vol. 71 (1988), pp. 117–147.
13. Coleman, D.D., "The Use of Geochemical Fingerprinting to Identify Migrated Gas at the Epps Underground Gas Storage Field," SPE Annual Technical Conference and Exhibition, Washington, Oct. 4-7, 1992.
14. Coleman, D., "Advances in the Use of Geochemical Fingerprinting for Gas Identification," American Gas Association Operations Conference, San Francisco, May 9-11, 1994.
15. Hoefs, J., "Stable Isotope Geochemistry," 4th ed. Berlin: Springer-Verlag, 1997.
16. Saba, T., and Boehm, P.D., "Use of Natural Gas Compositional Tracers to Investigate Gas Migration from a Gas Storage Field," Environ. Geosci., Vol. 19, No. 2 (2012), pp.1–12.
17. Baldassare, F., "Geochemistry of Natural Gases in Quaternary through Devonian Age Strata in the Northern Appalachian Basin: Implications for Investigations of Stray Gas Migration," Groundwater Protection Council, Sept. 28, 2011.
18. Burruss, R.C., and Laughrey, C.D., "Carbon and Hydrogen Isotopic Reversals in Deep Basin Gas: Evidence for Limits to the Stability of Hydrocarbons," Organic Geochem., Vol. 41, No. 12 (2010), pp. 1285–1296.
19. Parkhurst, D.L., and Appelo, C.A.J., "User's Guide to PHREEQC (version 2)—A Computer Program for Speciation, Batch-Reaction, One-Dimensional Transport, and Inverse Geochemical Calculations," US Geological Survey Water-Resources Investigations Report 99-4259 (1999).
20. Mullaney, J.R., Lorenz, D.L., and Arntson, A.D., "Chloride in Groundwater and Surface Water in Areas Underlain by the Glacial Aquifer System, Northern US," US Geological Survey, National Water-Quality Assessment Program, Scientific Investigations Report 2009–5086.
21. Panno, S.V., Hackley, K.C., Hwang, H.H., Greenberg, S.E., Krapac, I.G., Landsberger, S., and O'Kelly, D.J., "Characterization and Identification of Na-Cl Sources in Groundwater," Groundwater, Vol. 44, No. 2 (2006), pp. 176-187.
22. Kight, M., and Siegel, D.I., "A Protocol for Characterize Flowback Water Contamination to Shallow Waters from Shale Gas Development," Geological Society of America Abstracts with Programs, Vol. 43, No. 1 (2011), p. 76.
23. Boehm, P.D., "Polycyclic Aromatic Hydrocarbons," Chapter 6 in Environmental Forensics – A Contaminant Specific Approach. R. Morrison and B. Murphy, Eds. New York: Elsevier, 2006.
24. Brenner, R.C., Magar, W.S., Ickes, J.A., Abbott, J.E., Stout, S.A., Crecelius, E.A., and Bingler, L.S., "Characterization and Fate of PAH-Contaminated Sediments at the Wyckoff/Eagle Harbor Superfund Site," Environmental Science and Technology, Vol. 36, No. 12 (2002), pp. 2605 – 2613.
25. Vengosh, A., Warner, N., Osborn, S., and Jackson, R., "Elucidating Water Contamination by Fracturing Fluids and Formation Waters from Gas Wells: Integrating Isotopic and Geochemical Tracers," US Environmental Protection Agency, Workshop on Fracturing Fluid Composition, Feb. 24-25, 2011.
26. "Naturally Occurring Radionuclides in the Groundwater of Southeastern PA," US Geological Survey Fact Sheet 012-00, 2000.
27. Baldassare, F., "The Origin of Some Natural Gases in Permian through Devonian Age Systems in the Appalachian Basin and the Relationship to Incidents of Stray Gas Migration," Technical Workshops for Hydraulic Fracturing Study, Feb. 24-27, 2011.
The author
Tarek Saba ([email protected]) is a senior managing scientist at the Environmental Sciences practice of Exponent Inc., Maynard, Mass., and previously worked on a groundwater remediation technology development program as a subcontractor for the US Environmental Protection Agency. He earned and a PhD from the University of Colorado at Boulder.


