Oil, fundamental analysis
Crude’s rally continued this week on the heels of the Biden administrations announcement of new sanctions against several Russian entities and as an 8th-straight week of inventory drawdowns brought new concerns over supplies.
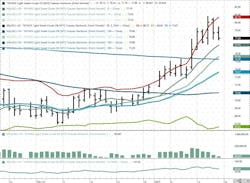
WTI was trading above the 100-day Moving Average (MA) and the Upper-Bollinger Band limit last week but shot through the critical 200-day MA this week. By week’s end, a ceasefire agreement between Israel and Hama lessened the geopolitical impact on Middle East oil while refined product stock gains also helped cap the uptrend.
WTI’s High for the week was $80.77/bbl on Wednesday and was the highest price since July. The Low was Monday’s open at $76.55. Brent’s Hi/Lo was $82.63/$79.60 with both occurring Wednesday. Both grades are higher on the week. The WTI/Brent spread has widened to -$3.50/bbl.
The new sanctions package issued last week by the Biden administration included about 180 specific vessels, several senior Russian oil executives, dozens of traders as well as, Russian oil & gas companies Surgutneftgas and Gazprom Neft. India has stated that it will honor the sanctions while tanker watchers have observed sanctioned ships off-loading in Chinese ports.
The sanctions do exempt vessels loaded before Jan. 10 with a delivery date before Mar. 12. And, while the initial sanctions imposed by the West when Russia invaded Ukraine have had little impact, if the vessel-specific actions work, Russia will lose many of the “shadow” tankers that have allowed their Urals to get to markets in India and China.
The proposed ceasefire between Israel and Hamas should be in effect this Sunday. The agreement is, in principal, similar to previously-proposed agreements with prisoner releases still to be worked out.
The OPEC+ group will be facing a variety of factors while considering its output plans for 2025. Currently, they have pushed back any output increase until at least April and then would only spread-out additional volumes over several months. Meanwhile, key players such as Russia, Iraq and Kazakhstan are notorious for non-compliance with the voluntary quotas. With the new sanctions on Russia and possible sanctions on Iran and Venezuela coming with the new administration, OPEC+ may decide to initiate output increases sooner than later. On the other hand, production continues to grow for non-OPEC countries such as the US, Canada, Brazil, Guyana, and Argentina.
The International Energy Agency's (IEA) latest forecast for oil demand growth this year is +1.05 million b/d while supplies are expected to increase +1.8 million b/d. Of course, the aforementioned sanctions and further potential sanctions could impact the supply scenario. RBC Bank sees the current rally as lacking fundamental underpinnings and cites macroeconomics, weak refined product markets and "looming oversupply." Additionally, China has yet to return to the levels of demand that existed prior to their economic woes.
The Energy Information Administration's (EIA) Weekly Petroleum Status Report indicated that commercial crude oil inventories for last week decreased while refined products increased substantially. Inventory at the key Cushing, OK hub changed +765,000 bbl to 21 million bbl or 28% of capacity. (The prior week, stocks were at a 5-year low causing concerns over US reserves in general). The SPR gained 0.5 million bbl to 394.3 million bbl. Total US oil production dipped -82,000 b/d to 13.48 million b/d vs. 13.3 last year at this time.
A positive inflation report also helped crude prices. The CPI for December came in at 2.9%, which was +0.04% higher than November’s reading but within expectations. “Core” inflation, which excludes the food and energy components, rose +0.2%, the smallest increase since last July and lower than a forecasted +0.3%. In addition to the encouraging inflation report, retail sales for December were +0.4%, just below the consensus expectation of +0.5%. Negative economic news came in the form of higher jobless claims for last week as they rose +14,000 to 217,000. Forecasts called for 210,000 initial claims. All three major US stock indexes are lower week-on-week. The USD continues to remain strong but was lower at week’s end.
Oil, technical analysis
February 2025 NYMEX WTI Futures prices continue to trade above the 8-, 13-, 21, 100 and 200-day Moving Averages but have fallen back under the Upper-Bollinger Band limit, a Sell signal. Furthermore, they have moved well past the 100-day MA. Volume is below-average at 67,000 as traders shift focus to the March 2025 contract. The Relative Strength Indicator (RSI), a momentum indicator, is “oversold” at the “64” mark. (“30” or below is considered very oversold while “70” or above is considered very overbought.) Resistance is now pegged at $79.00 with near-term Support at $75.29 (the 200-day MA).
Looking ahead
The new polar vortex could last up to two weeks and bring strong demand for domestic heating oil along the Eastern Seaboard. The market will now be watching for any actual disruption of Russian exports due to the newly-imposed sanctions. If successful, analysts see as much as 1.0 million bbl. being curtailed. Meanwhile, we will see if the proposed Israel/Hamas ceasefire lasts.
Natural gas, fundamental analysis
February natural gas continued its rally into a 10th day this week on the impact of the polar vortex and on a large storage withdrawal. Futures traded above the $4.00/MMbtu mark all 5 days this week and reached a high of $4.37 on Monday. Prices retreated at week’s end and settled lower week-on-week.
In Europe, prices are lower but still around the $12.00/MMbtu level. Supply last week was -0.9 bcfd to 110.5 bcfd vs. 111.4 the prior week. Demand was 147.9 bcfd, up from 145.5 the week prior, with the biggest increase in residential consumption.
Exports to Mexico were 6.8 bcfd vs. 6.2 the prior week. LNG exports were at a new high of 15.4 bcfd vs. 15.2 the prior week. The EIA’s Weekly Natural Gas Storage Report indicated a withdrawal of 258 bcf vs. a forecast of -258 bcf and vs. the 5-year average of -128 Bcf. Total gas in storage is now 3.413 tcf, dropping to -3.4% below last year and 2.5% over the 5-year average.
Natural gas, technical analysis
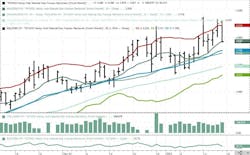
February 2025 NYMEX Henry Hub Natural Gas futures have retreated to right at the 8-day Moving Averages and above the 13- and 21-day MAs. Volume is about average at 189,000. The RSI is “neutral” at “56”. Support is pegged at $3.90 with Resistance at $4.00.
Looking ahead
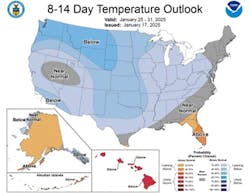
A pending polar vortex should result in substantial demand for natural gas as low temperatures will reach as far south as the US Gulf Coast. Supply freeze-offs are likely in most basins. The 8-14-day forecast appears to be more of the same with 2/3rds of the US experiencing below-normal temps.
About the Author

Tom Seng
Dr. Tom Seng is an Assistant Professor of Professional Practice in Energy at the Ralph Lowe Energy Institute, Neeley School of Business, Texas Christian University, in Fort Worth, Tex.


