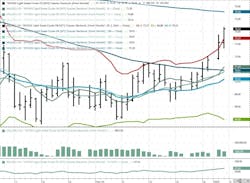
The new year has started with a new rally for oil prices fueled by stronger stimulus measures proposed by the Chinese government and by a draw in crude inventories. Additionally, with cold fronts hitting the US, UK, and EU, where heating oil and gasoil are widely used for radiant space heating, demand for these distillates will raise prices. West Texas Intermediate (WTI) rallied to a weekly high of just over $74.00/bbl. on Friday, the highest mark since October. The low was Monday, Dec. 30, at $70.10.
Brent’s high-low was $76.55-$73.05. The WTI-Brent spread has tightened to -$3.30/bbl and the rally has led to a breach of key technical areas including the 100-day moving average (MA) and the Upper-Bollinger Band limit. The next significant target would be the 200-day MA at $75.60/bbl. On the bearish side this week, inventories of refined products increased substantially. WTI actually finished 2024 down -0.4% from December 2023.
Chinese factory activity advanced for the third straight month in December 2024 while the country’s president indicated 2024 full-year growth would come in at +5%. The US Energy Information Administration (EIA), in its latest Short-Term Energy Outlook (STEO), anticipated India leading the increase in oil demand both for 2024 and 2025, representing as much as 25% of the growth in crude consumption. Meanwhile, the agency is reporting that domestic oil production in 2024 set a new record, averaging 13.29 million b/d. and surpassing 2023’s 12.9 million b/d. Efficiency gains and technological advancements were described as the primary driving forces for the increases.
The incoming administration remains a wild card in terms of its policy impacts on oil prices. The imposition of a 25% tariff on much-needed heavy crude from Canada would lead to higher prices and fuel inflation. Furthermore, a tightening of sanctions on Iran could reduce their oil exports and impact their largest market, China.
EIA’s Weekly Petroleum Status Report indicated that commercial crude oil inventories for last week decreased while refined products increased substantially. Total US oil production dipped 12,000 b/d to 13.573 million b/d. vs. 13.2 million b/d last year at this time.
The manufacturing purchasing managers’ index for December 2024 came in at 49.3 vs. November’s 48.4 indicating less contraction. Meanwhile, claims for unemployment last week were 211,000, the lowest since March 2024. Sales of new, single-family homes rose 5.9% in November over October and 8.7% over November 2023. Despite these positive indicators, all three major US stock indexes were lower week-on-week. The US dollar continues to remain strong and is at its highest level since October 2022, largely on the latest interest rate cut. The higher dollar week-on-week, however, did not stop the rally in crude.
Oil technical analysis
February 2025 NYMEX WTI Futures prices have shot past the 8-, 13-, and 21-day MAs and the Upper-Bollinger Band limit, a sell signal. Furthermore, they have moved well past the 100-day MA. The market may make an attempt at the 200-day MA (currently $75.60/bbl), but that would require a lot more momentum. Volume, shown in the second box, is below average at 190,000. The relative strength indicator (RSI), a momentum indicator shown in the third box, is “oversold” at the 67 mark. 30 or below is considered very oversold while “70” or above is considered very overbought. This coincides with the breakout above the Upper-Bollinger Band. Both are strong sell signals. Resistance is now pegged at $74.40 with near-term support at $73.50 (Upper-Bollinger Band mark).
Looking ahead
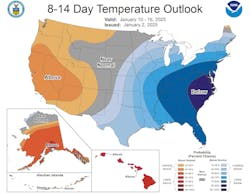
While China has reported some economic improvements, traders will need to see sustained strength to keep prices at higher levels. The Middle East will still be monitored for any possible disruptions of Iranian or Iraqi supplies. The polar vortex moving down looks to impact a smaller geographic area in the 8-14-day forecast. Until then, heating oil demand in the Northeast should be strong.
Natural gas
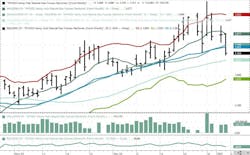
February natural gas got a huge boost last week with the arctic blast in focus. The short-term forecast calling for much-below normal temperatures had natural gas breaking out above the $4.00/MMbtu mark. A lower-than-forecast storage withdrawal and a change in the forecasted duration of the polar vortex, however, had prices retreating at week’s end. In Europe, due to the expiration of the natural gas pipeline transit agreement through Ukraine, a major source of Russian gas is no longer reaching Western Europe, driving prices higher there as cold weather sets in. Additionally, the EU has been drawing storage gas at a higher rate than expected due to both demand and lower imports of LNG. Recent quotes were $14.65/MMBtu after hitting a high of $15.00/MMbtu (highest since October 2023).
In the US the week’s high for February NYMEX futures was $4.20/MMbtu on Monday while the low was Friday’s $3.33. Supply last week fell 0.3 bcfd to 110.2 bcfd. Demand was 127 bcfd, down from 128.7 the week prior, with the biggest decrease in the power sector. Exports to Mexico were 6.0 bcfd vs. 6.3 the prior week. LNG exports were 14.3 bcfd vs. 14.2 bcfd the week before.
EIA’s Weekly Natural Gas Storage Report indicated a withdrawal of just 116 bcf vs. a forecast of 131 bcf and vs. the 5-year average of 104 bcf. Total gas in storage finished the week at 3.413 tcf, 1.8% below last year but 4.7% above the 5-year average.
Gas technical analysis
February 2025 NYMEX Henry Hub Natural Gas futures retreated below the 8 and 13-day MAs but remained above the 21-day MA. Volume is about average at 150,000. The RSI is “neutral” at “49”. Support is pegged at $3.30 with resistance at $3.45.
Looking ahead
US LNG exports averaged 12 bcfd in 2024 according to the EIA and are expected to increase by 15% this year as new projects come online and demand increases. Europe was the destination for 55% of US LNG exports last year. The pending polar vortex should result in substantial demand for natural gas and could cause supply freeze-offs in the Marcellus and Utica shales. As previously mentioned, in the 8-14-day forecast, much-below average temperatures will continue to exist but within a smaller area along the eastern seaboard. Look for a larger storage withdrawal to be reported next week.
About the Author

Tom Seng
Dr. Tom Seng is an Assistant Professor of Professional Practice in Energy at the Ralph Lowe Energy Institute, Neeley School of Business, Texas Christian University, in Fort Worth, Tex.


