Crude prices broke out of a consolidation pattern this week but unexpectedly to the downside, despite OPEC+ delaying any output increase until at least April of next year.
WTI had been bouncing between $67.70 and $70.50 as traders took positions based upon the Middle East conflict, Russia/Ukraine, demand concerns and, while they awaited the cartel’s decision on an output increase that had been delayed at least twice before. In the end, the specter of lower future consumption weighed on the market. Additionally, while a large draw in crude inventory was bullish for prices, the gains in refined products proved bearish.
WTI saw a weekly Hi/Lo range of $70.50/bbl (Wednesday)/$67.00 (Friday). Brent North Sea crude echoed the pricing pattern with a Hi/Lo of $74.25/$70.85. Both grades settled lower week-on-week. The WTI/Brent spread has widened to -$4.10/bbl.
Not only did it delay an increase in exports, the OPEC+ group is spreading-out the future lifting of curtailment volumes across an 18-month period, further lessening the market impact. With additional OPEC+ barrels not hitting the global market any sooner than 2Q25, Morgan Stanley has lowered their surplus projections for next year from +1.3 million b/d to +800k b/d, but a surplus remains, nonetheless. The World Bank has projected the overhang to be closer to +1.2 million b/d and cites the increased activity in global offshore exploration and production as part of their analysis.
China remains a key factor in oil market price movements as demand there remains a concern. October consumption was -5.4 year-on-year while year-to-date usage has been -4.0%. Reuters is forecasting that China’s oil demand will peak next year citing increased EV and Hybrid vehicle sales there along with economic weakness.
Argentina’s Vaca Muerta shale play produced 400,000 b/d in this year's third quarter, a new record. Forecasts call for as much as 1.0 million b/d by 2030. Meanwhile, Libya, Africa’s largest holder of oil reserves, hit a decade-high 1.4 million b/d in oil and condensate production this week. Conflicts between its West and East governing jurisdictions had halted production until a settlement was reached in September. Both Eni and BP are actively drilling. Libya is not subject to OPEC’s production caps.
The Energy Information Administration’s (EIA) Weekly Petroleum Status Report indicated that commercial crude oil inventories for last week decreased substantially while refined product gains offset the drop in feedstock. Total US oil production rose 20,000 b/d to 13.513 million b/d vs. 13.1 last year at this time. (It should be noted that this is the first time the EIA has used a more granular supply number.) The US rig count rose by 7 last week to 589 vs. 616 a year-ago.
The November Labor Department jobs report indicated a gain of 227,000, in line with expectations and representing solid growth. The unemployment rate did tick-up to 4.2% from 4.1%, however. October employment figures were adjusted upwards to +36,000 from the initial 12,000. (The lower numbers were attributed to weather events and strikes.) Additionally, average hourly wages increased 4% over the prior year vs. an expectation of +3.9%. However, the ISM’s services index fell 3.9% to 52.1, weaker than expected. And ADP’s private sector employment change was +146,000, lower than a forecasted +150,000. The latter reports weighed on oil prices.
Claims for unemployment compensation last week rose 9,000 to 224,000 vs. an expected 215,000. The US trade deficit fell by 1.6% last month over September. However, year-to-date, the deficit is 12.3% higher than the same period in 2023. The Dow is down on the week while the S&P and NASDAQ are both trading higher. The USD is also up, which is bearish for oil prices.
Oil, technical analysis
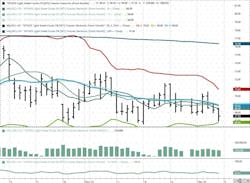
January NYMEX WTI Futures prices are trading below the 8-, 13-, and 21-day Moving Averages (MA) on Friday’s fall. Volume is about average at 235,000. The Relative Strength Indicator (RSI), a momentum indicator, is neutral at the 43 mark. 30 or below is considered very oversold while 70 or above is considered very overbought. Resistance is now pegged at $68.50 (8-day MA) with near-term Support at $67.00.
Looking ahead
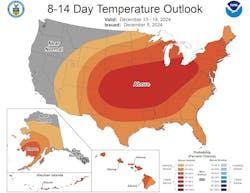
As we have seen for several months now, projections for declining demand have over-ridden most other factors over the longer term. And the near-term prospects don’t favor an increase. OPEC+ pushing back the lifting of output quotas has only served to keep prices from cratering further. That being said, events in the Middle East and the Russia/Ukraine war could spark supply concerns in an instant. From a US domestic heating oil demand perspective, the 8–14-day forecast looks mostly bearish.
Natural gas, fundamental analysis
Natural gas prices have been dictated by trader weather perceptions on any given day. And, this week, the 8–14-day forecast led to lower prices. Granted, there has been cold and snow in major US cities in the Midwest and East coast, but the market is trading next month.
A lower-than-forecasted storage withdrawal only added a bearish outlook. The week’s High was $3.28/MMbtu on Monday while the Low was Wednesday’s $2.97. European gas prices were lower this week as Russia changed the payment methods for exports to allow 3rd-party banks to facilitate the transactions thus, potentially thwarting US sanctions. EU storage levels have been drawn on considerably and now stand at 84% full.
European natural gas prices were most recently at $13.60/MMbtu equivalent. Supply last week was +0.2 bcfd to 109.7 bcfd vs. 109.5 the prior week. Demand was 135.9 bcfd, up from 117.4 the week prior with the biggest increase in Residential usage. Exports to Mexico were 5.9 bcfd vs. 5.8 the prior week. LNG exports were 14.5 bcfd. vs. 14.0 the prior week. The latest European natural gas prices were quoted at around $11.70/MMbtu.
The EIA’s Weekly Natural Gas Storage Report indicated a withdrawal of 30 bcf vs. a forecast of -48 bcf and vs. the 5-year average of -47 bcf. Total gas in storage is now 3.937 tcf, rising to 4.9% above last year and rising 7.8% over the 5-year average.
Natural gas, technical analysis
December 2024 NYMEX Henry Hub Natural Gas futures are around the 13- and 21-day Moving Averages and below the 8-day MA. Volume is about average at 135,000. The RSI is neutral at 52. Support is pegged at $3.00 with Resistance at $3.10.
Looking ahead
TotalEnergies, Japan’s Mitsui, and the government of Mozambique are finalizing plans to restart construction of the country’s $20-billion LNG project and are working towards a final investment decision.
Meanwhile, Petrobras and its partner, Ecopetrol, confirmed the largest gas discovery in the history of Colombia (OGJ Online Dec. 6, 2024). Drilling of the Sirius-2 well in the Gujaira basin proved reserves of more than 6 tcf.
The 14.5-bcfd of LNG last week is the highest in several months. As with heating oil, natural gas demand in the 8-14-day forecast looks bleak.
About the Author

Tom Seng
Dr. Tom Seng is an Assistant Professor of Professional Practice in Energy at the Ralph Lowe Energy Institute, Neeley School of Business, Texas Christian University, in Fort Worth, Tex.


