Oil, fundamental analysis
The conflict in the Middle East has been onging for a year, hanging over global crude markets. Supply disruptions thus far have been caused by Houthi rebel attacks on ships in the Red Sea. The oil market focus has been on the supply/demand imbalance with concerns largely over China’s economy.
That all changed this week when Iran attacked Israel in retaliation for the killing of key Hezbollah leaders in Beirut. The result was a large run-up in oil prices with a +$7.00/bbl gain over last week’s settlement despite an unexpected increase in commercial inventories and a large drop in refinery usage. Tuesday alone saw a high/low range of $71.95/$66.30 (the week’s low). Further momentum has led to the weekly high of $75.60/bbl (Friday).
Brent crude also hit its low on Tuesday at $69.90/bbl and a high of $79.30 on Friday. Both grades of oil look to settle much higher week-on-week and returning to levels last seen in early September. The WTI/Brent spread has widened to -$4.45.
Oil prices got an additional boost Thursday when President Biden reported he'd been in discussions with Israel regarding its plans to target Iranian oil infrastructure. Additionally, Iran has been backing both Hamas and Houthi rebel groups. A reduction in refining capacity in Iran would actually be bearish for oil demand. Whereas, targeted damage to Iran’s export infrastructure could take -1.5 million b/d off the global market. Israel continues to bomb targets in Beirut, Lebanon.
Yemeni-based Houthi rebels attacked an oil tanker in the Red Sea this week with an unmanned drone boat loaded with explosives. The event continues to underscore the dangers of shipping in the region and, as a result, many vessels have diverted and are going around the southern tip of Africa, a much more expensive route that can add as much as 2 weeks of additional time to market.
Saudi Arabia’s energy minister has warned OPEC+ members that, if they continue to produce oil above their quotas, prices could fall to $50/bbl. Specifically targeted were Iraq and Kazakhstan. However, OPEC oil output actually fell -390,000 b/d in September for a total output of 26.1 million b/d. The reduction in Libyan supply was the primary driver of the decline.
The Energy Information Administration’s (EIA) Weekly Petroleum Status Report indicated that commercial crude oil and gasoline inventories increased last week while distillate stocks fell. Total US oil production moved back to 13.3 million b/d vs. 13.2 million b/d last week and 12.9 last year at this time.
During this time last year, US oil production hit a record high of 12.5 b/d. Thus far, for 2024, crude supply has averaged 13.2 million b/d, a 6.5% increase. The US oil and gas rig count fell by 2 last week to 585 total vs. 619 last year.
Positive economic news came in the form of September job creation and lower unemployment. 250,000 jobs were added last month resulting in an unemployment rate of 4.1%, less than the projected 4.2%. On the flip side, US factory orders were -0.2% in August vs. no change forecasted.
Meanwhile, September’s PMI was steady at 47.2. Below 50 is considered contraction. All three major US stock indexes are down only slightly for the week. The unemployment report strengthened the USD which is keeping somewhat of a cap on oil’s current rally.
Oil, technical analysis
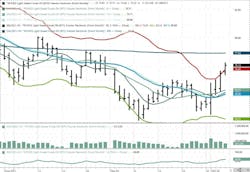
November 2024 WTI NYMEX futures prices have rallied past the 8-, 13, and 21-day Moving Averages and have breached a key Resistance point which is the Upper-Bollinger Band. This measures the distance from the Mean which now indicates 2-Standard Deviations away from its average. Selling normally follows such a breakout. Volume is about average at 340,000. It should be noted that almost 670,000 contracts traded on the large move Tuesday. That’s the equivalent of 670 million bbl of oil trading on paper.
The Relative Strength Indicator (RSI), a momentum indicator, is oversold at the 60 mark. Thirty or below is considered very oversold while 70 or above is considered very overbought. Resistance is now pegged at $76.00 with the next level at $77.34 the 200-day Moving Average. Near-term Support is $ $74.35, the Upper-Bollinger Band limit.
Looking ahead
Markets will be looking for specific interruption of oil production and/or exports if the current rally will be sustained. As mentioned in a prior report, Israel seems bent on the total annihilation of all rebel groups in which it has conflict. However, this direct Israel/Iran skirmish could have wide-ranging consequences for the region should other Arab nations choose to stand with Iran.
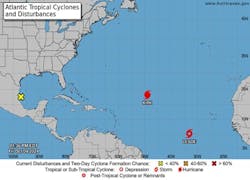
Meanwhile, in North America, another tropical system is building in the Bay of Campeche area. Some forecasters believe a system in the Pacific will move over Mexico and join it. Florida appears to be the target once more as its expected that high winds aloft will steer the system to the East and away from Gulf of Mexico oil and gas infrastructure. Time will tell.
Additionally, the positive unemployment numbers may provide more incentive for the Federal Reserve to cut rates once more sooner than later.
Natural gas, fundamental analysis
November natural gas futures ran past $3.00/MMbtu this week on shrinking storage surpluses and on some early cold in the Northeast. But it failed to sustain the momentum and settled lower week-on-week. The week’s high was $3.02/MMbtu on Friday while the low was Tuesday’s $2.82.
Supply last week was 107.4 bcfd vs. 107.2 the prior week. Demand was 95.9 bcfd, down from 98.6 the week prior with a drop in power. Exports to Mexico were 6.7 bcfd vs. 6.9 the prior week. LNG exports were 12.4 bcfd. vs. 12.6 the prior week.
The latest European natural gas prices were quoted at about $11.75/MMbtu. The EIA’s Weekly Natural Gas Storage Report indicated an injection of 55 bcf vs. a forecast of 58 bcf. Total gas in storage is now 3.547 tcf, 3.70% above last year and 5.7% over the 5-year average.
Natural gas, technical analysis
November 2024 NYMEX Henry Hub Natural Gas futures are now trading above the 8-, 13- and 21-day Moving Averages. Prices remain well-above the Upper-Bollinger Band level, a pending sell signal. Volume is rising at 155,000. The RSI is overbought at 65, another sell signal. Support is pegged at $2.85 with Resistance at $3.00.
Looking ahead
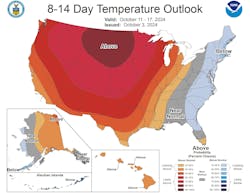
Fall is returning and there are early signs of colder temperatures in the Northeast. Natural gas production in the Gulf of Mexico could also be impacted by any development of the storm system growing near the Yucatan. The 8–14-day forecast indicates above-normal temperatures for the western 2/3 of the US but below-normal for the Eastern Seaboard.
About the Author

Tom Seng
Dr. Tom Seng is an Assistant Professor of Professional Practice in Energy at the Ralph Lowe Energy Institute, Neeley School of Business, Texas Christian University, in Fort Worth, Tex.


