Oil market to tighten second-half 2024
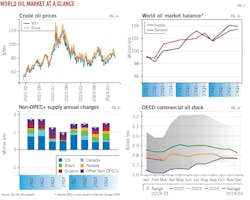
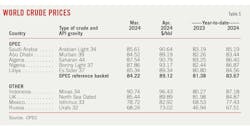
Despite substantial central bank interest rate hikes, the global economy has demonstrated remarkable resilience. The global manufacturing Purchasing Managers’ Index (PMI) has consistently remained above 50—the threshold for contraction or expansion—over the first 4 months of 2024. This, combined with extended production cuts from the OPEC+ alliance and escalating geopolitical tensions in the Middle East, has led to a tighter oil market balance than originally expected. WTI crude oil surged to $86.90/bbl on Apr. 5 from $70.40/bbl at the beginning of the year. Similarly, Brent crude rose to $91.20/bbl from $75.90/bbl during the timeframe.
However, benchmark oil prices underwent a significant downward correction afterwards in April and early May due to retreated geopolitical risk premiums and concerns about the global economy and oil demand. On May 15, WTI dropped to $78/bbl, while Brent fell to $83/bbl.
Voluntary OPEC+ production reductions, coupled with rising demand, are driving down global oil inventories in first-half 2024, with an estimated average decrease of 250,000 b/d. Assume some OPEC+ producers will continue to limit production after current voluntary cuts expire at the end of June, a tighter oil market is foreseen for second-half 2024. This tightness is expected to result in a continuous decline in inventories through the rest of the year, maintaining elevated oil prices. Subsequent robust supply expansion is likely to prompt global oil inventory upticks in 2025, leading to price drops. Nevertheless, the situation in the Middle East introduces noteworthy uncertainties that could heighten oil price volatility and trigger sharp price escalations.
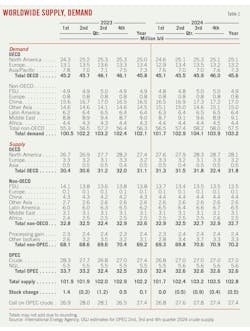
Global oil demand is set to rise by 1.1 million b/d in 2024, half of the growth seen in the previous year, according to the International Energy Agency (IEA). This is mainly due to a return to typical growth patterns following the disturbances caused by the COVID-19 pandemic.
China is set to lead global demand gains in 2024. However, China’s demand this year will decelerate sharply from last year, as the surge in pent-up travel demand following 2023’s post-COVID period fades away.
Recent US economic data has cooled off, lingering concerns about the US economy persist, and gasoline and diesel consumption has been weaker compared with the corresponding period of the previous year. Nevertheless, with the resilience of the US economy and the expected growth in gasoline consumption during the peak travel season, there is still support for oil demand.
OPEC+’s extended production cuts have partially balanced growth elsewhere, resulting in a global liquids deficit year-to-date. There is a strong willingness from OPEC+ to reinforce prices, and the production cuts are likely to be extended at the Jun. 1 meeting. Assuming that existing voluntary cuts are maintained, OPEC+ production will fall 840,000 b/d in 2024, according to IEA.
Non-OPEC output is expected to grow by 1.4 million b/d, with the Americas remaining this year’s mainstay of expansion, led by the US, Brazil, Guyana, and Canada. The recent high oil prices could encourage further growth in non-OPEC+ production. The US dominates the gains, representing 45% of the non-OPEC+ expansion this year.
On the natural gas side, the soft outlook is due to extensive gas storage inventories in the US and Europe. The US gas supply-demand balance will be driven by low gas prices discouraging new production and stimulating demand in the rest of the year.
World economy
The global economy has shown impressive resilience so far this year. As mentioned, the global Manufacturing PMI has consistently remained above the threshold of 50 throughout the first 4 months of 2024. Many economies have witnessed a decline in headline inflation, attributed to tight monetary policies, lowered energy expenses, and alleviated supply chain challenges.
The positive momentum in the global economy has led to adjustments in growth projections by major economic organizations worldwide. The Organization for Economic Cooperation and Development (OECD) upgraded its forecast for global economic growth in 2024 to 3.1% from 2.9%, while the International Monetary Fund (IMF) now expects a 3.2% growth rate, a slight increase from previous estimates in January. Additionally, the IMF foresees a reduction in global inflation from an average of 6.8% in 2023 to 5.9% in 2024 and 4.5% in 2025.
According to IMF, a slight acceleration for advanced economies—where growth is expected to rise from 1.6% in 2023 to 1.7% in 2024 and 1.8% in 2025—will be offset by a modest slowdown in emerging market and developing economies from 4.3% in 2023 to 4.2% in both 2024 and 2025.
In contrast to sluggish European economies, the US continues to exhibit robust growth. The US is expected to grow 2.7% this year, while Europe will grow 0.8%. The Chinese economy remains fragile, with issues in the real estate and associated sectors hindering overall growth. China will grow 4.6% this year, down from 5.2% last year.
Despite the improvements, uncertainties persist. While there has been a consistent drop in the price of core goods, service prices have remained notably elevated when compared to pre-pandemic levels.
Global monetary tightening is exerting pressure on the economy. The US’s decision to uphold elevated interest rates to counter inflation potentially poses risks of currency devaluation in other countries and unsettling international financial markets. Moreover, heightened geopolitical tensions are continuing to disrupt global industrial and supply chains, leading to increased operating expenses.
It’s worth noting that some recent economic indicators have raised concerns. Since mid-April, some US economic data has consistently fallen short of expectations, with initial jobless claims in early May exceeding forecasts and reaching their highest level since August 2023; China’s economic indicators have also slightly declined.
Global oil demand
IEA recently forecast oil demand to increase by 1.1 million b/d in 2024, representing half of the growth seen in the previous year. This growth forecast reflects a return to normal consumption patterns following the rebound from COVID-19 last year, as well as the challenges from the global macroeconomic landscape, efficiency improvements, and a rising electric vehicle fleet.
The anticipated growth in global liquid demand is to be driven by emerging markets, primarily China, Brazil, India, Indonesia, and Saudi Arabia, while advanced economies are likely to experience a slight dip in consumption levels.
Non-OECD countries take center stage in the outlook of demand, as the group encompasses many primary growth engines of the global economy. However, several countries are expected to experience substantial drops in demand growth due to economic challenges. Non-OECD oil demand is projected to increase by 1.2 million b/d in 2024 and 2025, compared with 3.2 million b/d in 2023.
China oil demand is expected to experience a moderated growth rate in 2024 compared with 2023. In 2023, Chinese oil demand was estimated at 16.5 million b/d, an increase of 1.8 million b/d from 2022. IEA expects an expansion of 510,000 b/d for China in 2024 and 360,000 b/d in 2025.
Penetration of electric vehicles has been on the rise in China. China, once the world’s drivers of gasoline demand, is expected to account for more than 50% of global electric vehicle sales this year, according to IEA. That said, China’s demand for LPG, ethane, and naphtha is expected to remain strong with its expansion of the petrochemical industry.
India’s robust economic expansion is anticipated to bolster ongoing liquid fuel demand. India is poised to see increased consumption of LPG and ethane, underpinned by government initiatives.
OECD oil usage is expected to see a decrease of 140,000 b/d in 2024 and a further decrease of 30,000 b/d in 2025.
Oil demand in the OECD Americas is projected to see a modest rise of around 100,000 b/d in 2024, following a 220,000 b/d increase in 2023. The growth observed thus far this year has been solely driven by higher LPG/ethane demand, while gasoil and gasoline consumption both declined compared to year-ago levels. This pattern is anticipated to persist throughout the remainder of the year.
In first-quarter 2024, oil consumption in OECD Europe stood at 12.9 million b/d, marking a decline of 200,000 b/d compared with an already weak year-ago baseline, and a deficit of 1.2 million b/d from the comparable 2019 level. The notable weaknesses in gasoil and petrochemical feedstocks are closely linked to a decline in industrial activities. IEA’s forecast indicates an overall decrease of 150,000 b/d in the region’s oil demand for 2024.
Notably, IEA projects that electric car sales could represent about 25% of total sales in Europe and over 11% in the US this year.
At a product level, gasoil exhibited the most sluggish performance, reflecting weak industrial activities. An exceptionally mild winter further dampened OECD heating fuel consumption. Ongoing challenges such as increasing vehicle efficiencies and the diminishing prevalence of diesel vehicles also contributed to the decline.
World oil supply
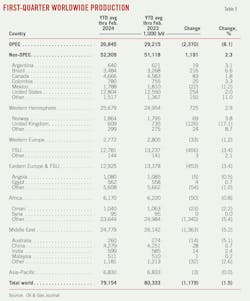
Several OPEC+ members, led by Saudi Arabia and Russia, announced in March an extension of voluntary oil output cuts of 2.2 million b/d into second-quarter 2024, providing the market with a boost amid concerns about global oil demand growth and rising production outside the group.
The extension of OPEC+ cuts is partially offsetting the expansion observed outside of OPEC+ and curbing the growth of world oil production this year. The group’s next course of action will be determined on Jun. 1, 2024. At the time of this writing, OGJ expects OPEC+ curbs to remain in place to maintain a balance in the global oil market and prevent substantial increases in global oil inventories.
Assuming that existing voluntary cuts are maintained, global production of petroleum and other liquid fuels is set to rise by around 550,000 b/d in 2024, a deceleration from the 1.8 million b/d growth recorded in 2023.
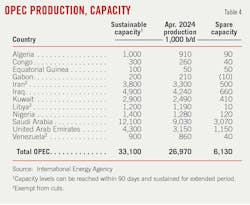
OPEC+ output is anticipated to decline by 840,000 b/d in 2024. Saudi Arabia’s crude oil production remains around 9 million b/d, while Iran’s crude oil production continues to grow. The Biden administration revived oil sanctions on Venezuela in April, saying President Nicolás Maduro reneged on democracy deal. Russian oil exports had been increasing in the first 3 months of 2024, but they dropped in April due to reduced product exports.
Production outside of OPEC+ is expected to increase by 1.8 million b/d, primarily driven by growth in the US, Canada, Brazil, and Guyana. The US dominates gains, representing 45% of the non-OPEC+ expansion this year.
In Canada, startup of the Trans Mountain pipeline expansion (TMX) will alleviate existing distribution constraints and enable gradual expansions of crude oil production. Canada’s yearly output is projected to increase by 140,000 b/d in 2024 and 2025, reaching 6 million b/d and 6.1 million b/d, respectively.
Brazilian output is forecast to grow by 100,000 b/d to 3.6 million b/d this year and by 260,000 b/d to 3.85 million b/d next year. Six FPSOs are starting up by end-2025 with a combined capacity of over 1 million b/d. This production rise, combined with a forecast of relatively steady refining throughput, suggests ongoing expansion in Brazil’s crude oil exports.
Following the launch of the third FPSO in December 2023, Guyana is expected to see a supply increase of 200,000 b/d in 2024. By 2025, production is expected to rise by another 120,000 b/d, averaging 710,000 b/d, as the fourth installation, Yellowtail, begins oil production.
Looking ahead to 2025, global liquid fuels production is forecast to increase by around 2 million b/d in a scenario where the OPEC+ production cuts expire, and production outside of OPEC+ continues its upward trajectory.
Global oil inventories
Voluntary OPEC+ production reductions are driving down global oil inventories in first-half 2024, with an expected average decrease of 250,000 b/d.
According to IEA data, OECD commercial inventories declined by 14.2 million bbl to 2,756 million bbl in March, remaining 74.7 million bbl below the 5-year average. Early data show OECD commercial inventories were up by 20.2 million bbl in April, of which the US accounted for 19.7 million bbl.
Assuming some OPEC+ producers will continue to limit production after current voluntary cuts expire at end-June, a tighter oil market is foreseen for second-half 2024. This tightness is expected to result in a continuous decline in global inventories through the rest of the year, maintaining elevated oil prices.
Subsequent robust supply expansion is likely to prompt global oil inventory upticks in 2025, leading to price drops.
US oil demand
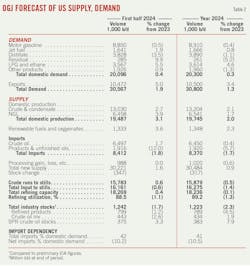
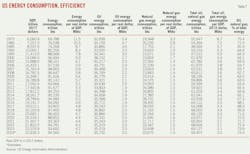
During first-half 2024, US oil demand is projected to reach 20.1 million b/d, a slight increase from 20 million b/d in the same period last year. OGJ expects total US oil consumption will average 20.4 million b/d for full-year 2024, a growth of 0.6% from 2023, mainly driven by increased consumption of hydrocarbon gas liquids (HGL).
Besides higher pump prices and a slowing labor market, structural headwinds such as vehicle efficiencies and an expanding EV fleet weigh on gasoline demand. The IEA projects that the share of electric cars sold this year could reach over 11% in the US. Nevertheless, with the resilience of the US economy and the expected growth in gasoline consumption during the peak travel season, there remains backing for gasoline demand.
The demand for HGL in the year’s first half is anticipated to be 3.56 million b/d, a 5.5% rise from the previous year. Ethane demand as a petrochemical feedstock stays robust, exhibiting double-digit growth in the first quarter, contrasting sharply with the stagnation in other product categories. OGJ forecasts a 5% increase in HGL demand in 2024, serving as the primary driver of US gains. Nevertheless, US petrochemical plant capacity additions over the next 2 years will be limited.
Estimated US distillate fuel consumption averages 3.83 million b/d in first-half 2024, down from 3.97 million b/d in first-half 2023. OGJ forecasts that US distillate fuel consumption will decrease 1.1% in 2024.
US distillate consumption so far this year has been lower than usual due to a combination of factors, including warm winter weather, reduced manufacturing activity, and the ongoing replacement of biofuels for petroleum distillate on the US West Coast. However, a gradual improvement during the course of 2024 is expected.
Compared with the winter of 2022–23, the winter of 2023–24 was about 5% warmer based on heating degree days, resulting in less usage of heating oil. Meantime, a decline in industrial production, including manufacturing, mining, and utilities, led to lower US distillate fuel consumption. Data from the US Bureau of Transportation Statistics show that trucking freight, as measured by the seasonally adjusted truck tonnage index, decreased by 2.5% y-o-y in the first quarter. In the West Coast region, renewable diesel is capturing a larger portion of the region’s diesel fuel market owing to incentives for its consumption under clean-fuel initiatives.
US jet fuel consumption for the first 6 months is estimated to average 1.64 million b/d, 1.9% higher than a year earlier. OGJ expects that US jet fuel consumption will increase by 1% in 2024.
Estimated demand for residual fuel averaged 285,000 b/d in the year’s first half, compared with 259,000 b/d in first-half 2023. OGJ forecasts demand for residual fuel to decline 5% in 2024.
US oil production
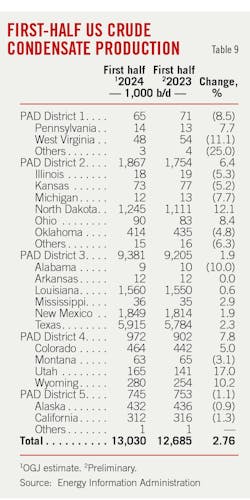
After the harsh winter weather struck key production regions in North Dakota, Colorado, New Mexico, and Texas in January, US crude production has rebounded since February and sustained robust momentum. For first-half 2024, estimated US crude oil production averaged 13 million b/d, a 3% increase from 12.64 million b/d in first-half 2023.
Challenges brought by a wave of acquisitions and lowered capital guidance from public companies might impede shale oil growth. However, despite these hurdles, the shale landscape retains strong growth momentum in 2024.
Baker Hughes reported that in the week ended May 3, 2024, the count of active US oil rigs stood at 499, down from 570 rigs active in the same period the previous year. This decrease in US oil rigs and rising production indicates a substantial enhancement in productivity. Given the current oil prices at around $80/bbl, there is ongoing potential for a rise in the number of rigs in the US. Continuous improvement in production efficiency and the potential growth in the number of rigs are key factors driving the increase in US oil production.
Over the period from April 2023 to April 2024, drilled but uncompleted wells (DUCs) decreased to 4,510 from 5,323, according to the US Energy Information Administration (EIA)’s Drilling Productivity Report.
In the Permian basin, crude oil production rose to over 6.1 million b/d in first-half 2024 from 5.8 million b/d in the initial 6 months of 2023. Concurrently, the Permian basin rig count stood at 317 in April 2024, down from 356 a year earlier.
The increase in US shale oil production and the reduction in extraction costs is highly correlated with the application of artificial intelligence (AI) technology, with reduced drilling time and a shortened hydraulic fracturing process. According to research from Evercore ISI, AI and other technologies may reduce costs in the shale patch by double-digit percentages this year, potentially saving 25-50% of costs in certain scenarios.
The Gulf of Mexico is projected to see a modest decrease in crude oil production in 2024. Next year could see a strong growth as five major projects start up by end-2025. In 2023, Gulf of Mexico production averaged 1.86 million b/d, a 7.65% increase from the previous year.
Overall, OGJ forecasts that US crude oil production will average 13.2 million b/d for full-year 2024, a 2% increase from the 2023 level.
In terms of US natural gas liquids (NGL) production, there was an 8.4% increase in 2023 to 6.43 million b/d, with a forecasted 1.7% increase to reach 6.54 million b/d in 2024. Combined, the total domestic oil production in the US for 2024 is anticipated to rise by 2% from the previous year, reaching 19.75 million b/d.
US refining
In January and February 2024, US crude oil refinery inputs experienced a significant decline due to the impact of cold winter conditions, scheduled maintenance at refineries along the Gulf Coast, and a major unplanned outage in the Midwest. Subsequently, refineries have been gradually ramping up operations in preparation for the approaching summer driving season.
Demand for US gasoline and distillate fuel has been lackluster so far this year, causing distillate fuel oil and motor gasoline inventories to persistently surpass previous-year levels. These factors exert pressure on refining margins.
The spread between US gasoline futures and US crude oil contracted, and the diesel crack spread also hit a 1-year low of around $23/bbl in early May. Meantime, for US refiners, the completion of TMX and capacity additions around the Atlantic Basin could also tighten crude differentials and weaken margins.
According to Muse Stancil & Co., refining cash margins for the first 4 months of 2024, the latest data available, averaged $20.79/bbl for the Midwest, $20.29/bbl for the West Coast, $18.43/bbl for the Gulf Coast, and $9.42/bbl for the East Coast. These compared with cash refining margins of $29.15/bbl, $24.85/bbl, $28.27/bbl, and $15.70/bbl, respectively, a year ago. For the same period in 2022, these refining margins averaged $18.83/bbl, $23.54/bbl, $20.33/bbl, and $14.23/bbl.
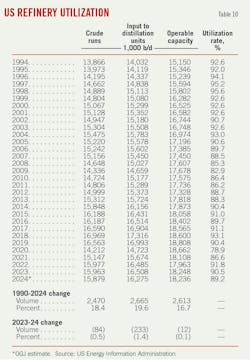
US refiners are projected to operate at an average utilization rate of 88.5% in first-half 2024, a decrease from 89.4% during the same period the previous year. For full-year 2024, OGJ anticipates an average utilization rate of 89.2%, down from 90.5% a year ago. Overall refinery runs in 2024 will average 15.9 million b/d, down slightly from 16 million b/d in 2023.
US oil trade
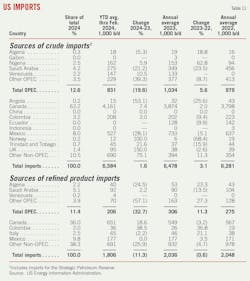
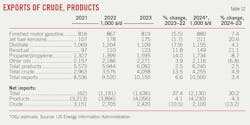
The continuous rise in US crude oil production paired with a decline in refinery runs is projected to lead to a decrease in US crude net imports towards the end of 2024 and into 2025. The trend of declining net crude oil imports, which has been consistent over several years, is expected to persist.
According to EIA, the start of the TMX pipeline on May 1, 2024, could introduce more uncertainty to US net crude oil imports. Historically, most of Canada’s crude oil exports have been directed towards the US Midwest. With the TMX in operation, it is likely that more of Canada’s crude oil will be exported from the country’s West Coast, decreasing imports from Canada to Midwest refiners.
EIA’s Weekly Petroleum Status Report shows higher US petroleum products exports so far this year. Ukraine’s strikes on Russian refineries leads to tightening global product supplies. However, the expansion of production in new refineries in the Middle East will help alleviate some of the international supply constraints.
US oil stocks
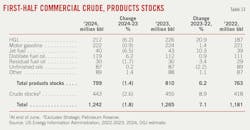
US commercial crude oil stocks are anticipated to be around 443 million bbl at the end of June 2024, down from 455 million bbl at the same time a year ago. Higher US crude oil production may not lead to inventory build-up, due to higher anticipated crude oil exports and a ramp up in refinery runs in the coming months. The amount of crude oil in the Strategic Petroleum Reserve (SPR) stood at 375 million bbl, compared with 363 million bbl a year ago.
Thus far this year, due to disappointing demand, stocks of distillate fuel oil and motor gasoline have consistently surpassed 2023 levels. As the summer driving season approaches, there could be a decline in motor gasoline inventory, whereas distillate fuel oil supplies might remain high due to subdued economic activities and increasing supply of biofuels.
US gas market
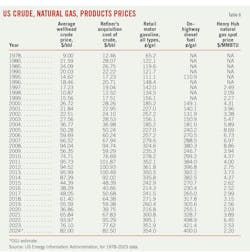
During February and March, spot gas prices at Henry Hub averaged under $2/MMbtu due to unusually warm winter conditions, leading to reduced demand for residential and commercial heating. This reduced demand, coupled with the storage surplus at the 2023 winter’s onset, led to a notable surge in US gas storage inventories. Since early this year, US working gas in storage has significantly surpassed levels from the preceding year and exceeded both the 5-year average and range.
By early May, the spot price had climbed back above $2/MMbtu mainly due to cutbacks in production and spending by US gas producers. This rise is further driven by increased demand stemming from cooler early spring temperatures and the demand for LNG feed gas along the Gulf Coast.
There could be a gradual tightening in the rest of 2024 due to the restraining effect of low gas prices on new production and the concurrent increase in new demand. This shift is anticipated to lead to a gradual drawdown of gas inventory and a rise in gas prices.
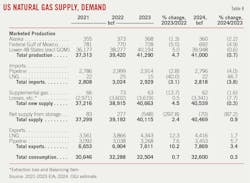
US natural gas consumption in 2024 will remain relatively stable compared with last year, averaging around 89 bcfd. Minor upticks in consumption are expected in the residential, commercial, and electric power sectors. If fourth-quarter 2024 sees cooler temperatures compared with the unusually warm fourth-quarter 2023, there will be heightened gas consumption in the residential and commercial sectors. However, those increases will be offset by a slight decrease in industrial sector consumption.
While gas production in key US regions is experiencing strong growth, US producers are expected to restrict supply in response to low natural gas prices. Moreover, the significant price disparity between natural gas and petroleum products is motivating producers to prioritize the production of higher-value NGLs. Dry natural gas production in the US is expected to decrease by 0.7% this year.
US net natural gas exports averaged 12.83 bcfd in 2023, up 22% from a year ago, and are expected to grow 8% in 2024 to reach 13.8 bcfd. The expansion in US natural gas trade will be predominantly driven by LNG exports.
US LNG exports are projected to rise by 1.7% in 2024, averaging 12 billion bcfd, a decrease from the previous year’s growth rate of 12%. The lower growth is attributed to maintenance operations and the limited expansion in global LNG demand this year. A mild winter in Europe, combined with decreased regional industrial activities, contributed to a drop in European gas demand and record levels of European gas storage at the end of the 2023-24 heating season. In 2025, there is a potential for an 18% growth in US LNG exports, with three LNG export projects currently under construction set to commence operations and scale up to full production by end-2025.
An increase in US natural gas pipeline exports to Mexico is also expected in 2024 as several pipelines in Mexico become fully operational in 2024–25. Meantime, flows via the Sur de Texas-Tuxpan underwater pipeline are likely to increase slightly in 2024 when it begins delivering natural gas from the US to Mexico’s first LNG export project, Fast LNG Altamira.
The US started the 2023 winter heating season with a 5% surplus to the 5-year average. The surplus at the start of winter and a mild 2023-24 winter led to the large storage inventory surplus at end-March. According to EIA, US natural gas storage inventories were 40% higher at the end of this withdrawal season than the 5-year (2019–2023) average and 23% more than last year at this time.
Due to lower gas production, less natural gas will be injected into storage than is typical during this year’s injection season. However, the US is set to end the injection season with over 4,000 bcf of natural gas in storage, around 10% more than the 5-year average and the most on record.
About the Author
Conglin Xu
Managing Editor-Economics
Conglin Xu, Managing Editor-Economics, covers worldwide oil and gas market developments and macroeconomic factors, conducts analytical economic and financial research, generates estimates and forecasts, and compiles production and reserves statistics for Oil & Gas Journal. She joined OGJ in 2012 as Senior Economics Editor.
Xu holds a PhD in International Economics from the University of California at Santa Cruz. She was a Short-term Consultant at the World Bank and Summer Intern at the International Monetary Fund.
Laura Bell-Hammer
Statistics Editor
Laura Bell-Hammer is the Statistics Editor for Oil & Gas Journal, where she has led the publication’s global data coverage and analytical reporting for more than three decades. She previously served as OGJ’s Survey Editor and had contributed to Oil & Gas Financial Journal before publication ceased in 2017. Before joining OGJ, she developed her industry foundation at Vintage Petroleum in Tulsa. Laura is a graduate of Oklahoma State University with a Bachelor of Science in Business Administration.
