Imbalances among oil demand, reserves, alternatives define energy dilemma today
HUBBERT REVISITED—1
A sizzling world economy is expected to grow 2.7% in 2004, the second-highest rate since 1990.
The biggest oil consumer in the world, the US, finally has its economy back on track, and its gross domestic product is set to expand by 4.4% this year.
China is continuing its oil consumption increase at a rate of 6%/year. All of this economic growth is generating a strong demand for energy, and oil prices are on the rise. Oil prices entered 2004 at $30/bbl (dated Brent) and by Mar. 19 had risen to their pre-Iraq-war peak of $33/bbl, the highest since 1990.
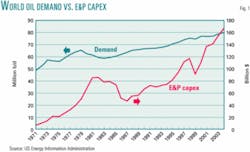
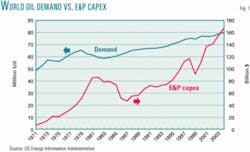
Current projections by the US Energy Information Administration indicate that world oil demand is expected to grow to 118 million b/d in 2025 from 78 million b/d of liquids in 2002. This represents an increase over the 1.5%/year average growth rate in world oil consumption since 1995.
With an assumed robust or even moderate growth in demand, there is an evident need to substantially increase oil reserves and to develop new production. After a dip in 2000 to a meager $90 billion, global capital spending on oil exploration and production has been on a steady climb and is expected to top $160 billion in 2004.1
World proven conventional oil reserves have increased only slightly since 1994, averaging growth of about 6 billion bbl/year.2 This increase of new reserves generated about 1 million b/d/year of new oil production, enough to satisfy the annual growth in global demand over the same period.
In January, Royal Dutch/Shell Group made a surprise announcement that its proven oil and gas reserves had been overestimated by 20%. Shortly afterward, BP PLC announced a larger-than-normal downward adjustment in its reserves revisions, which raised some concerns on Wall Street. Changes in proven reserves, especially downward, ring an alarm in the financial markets, as reserves are vital to a company's assets, its stock market value, and its ability to borrow. The association with earlier events of financial data misrepresentation by some corporations only serves to create a cloud of uncertainty over the accuracy of proven oil reserves and their capability to satisfy expected long-term global energy demand.
Furthermore, there is a shroud over the peaking of world oil production due to natural depletion by the 2010s.3
Apparent imbalances between increasing demand, diminishing reserves, and no visible substitute for oil ultimately define the energy dilemma.
Energy alternatives
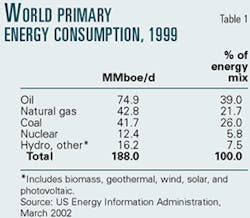
Oil is the world's most important primary energy source, providing 39% of total energy consumed (Table 1).
Of all oil produced, 61% is used as fuel for transportation and electric power plants. Both of these sectors are projected to grow at a faster pace than energy demand as a whole.4 It is essential to explore, at least on a cursory level, the alternatives to pick up the slack in these sectors when oil supplies go on the decline and to help extend the life of this important, nonrenewable energy source.
Worldwide electricity consumption, which utilizes 10% of world oil production as fuel, is projected by EIA to increase at a high rate of 2.7%/year through 2020. In the early 1970s, with the advent of commercial reactors, nuclear power seemed the most attractive alternate energy source for electric power generation, which at that time was powered principally by coal.5 Nuclear-powered electricity generation grew rapidly through the 1980s. Its use was mainly concentrated in developed countries and has remained that way. The US is the world leader, with a 30% share of the total installed nuclear generation capacity.
Nuclear power accounts for 16% of the worldwide electric power fuel market but is expected to decline as a result of safety concerns, waste disposal issues, etc. At the moment, nuclear power is not sociably acceptable. Not a single new reactor has been brought on line in the US since 1996. Moreover, natural uranium reserves are expected to peak in the next 25 years based on the existing global fleet of nuclear reactors. Although coal is still the dominant fuel in this market, natural gas is the preferred fuel to take up the slack because of environmental concerns.
The case for the transportation sector, which consumes more than half of world oil production, is by far the most complex and critical. Alternatives being developed range from those with short-term goals, such as compressed natural gas, LPG, and gasohol, to hydrogen-based fuels, which in the best circumstances would have a long term impact.
Other possible energy alternatives to replace oil in other diverse applications are wind, solar, geothermal, photovoltaic, and biomass. All these together provide less than 0.4% of the total primary energy consumed and the outlook for any significant impact on the world energy scenario is beyond 2020. Some energy conservation seems inevitable.
To quote Matthew Simmons, energy advisor to President George W. Bush: "We need a wake-up call. We need it desperately. We need basically a new form of energy. I don't know that there is one."
Reserves/production issue
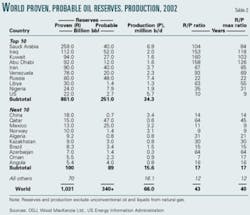
Of the 90 countries that produce oil, the top 10 account for 83% of the world's reserves and more than half of the world's oil production (Table 2). The 20 countries with proven reserves each exceeding 5 billion bbl account for more than 75% of the world's oil production and 93% of its proven reserves.
The reserves/production ratio (R/P ratio) is a quick-look indicator of the duration of reserves at the present production rate. Consequently, the current (2002) world oil reserves of 1.031 trillion bbl would last 43 years at a rate of 66 million b/d. More importantly, the R/P ratio is a useful tool to highlight comparative differences in the volumes of reserves reported among the different countries.
In general, reserves are developed to support a determined level of production capacity, or Pmax. The R/Pmax ratio between countries should fall within a narrow range of values. Variations would reflect geologic differences in productivity among the wells and the mix of oils, from heavy to light, that may characterize the country's production.
As illustrated in Table 2, half of the top 20 producing countries have R/Pmax values of 9-21. The top six countries, all belonging to the Organization of Petroleum Exporting Countries and accounting for 70% of the world's reserves, have R/Pmax values of 31-126.
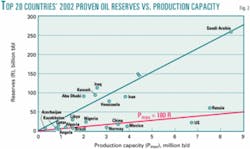
Fig. 2 shows reserves vs. production capacity for the top 20 producing countries in the world. The two trend lines shown essentially represent the correlation limits for OPEC and non-OPEC countries. As is apparent, OPEC countries report almost five times the reserves required to sustain the same level of production capacity as do non-OPEC countries. For instance, to develop 180,000 b/d of new oil production capacity would require discovering 1 billion bbl of reserves in countries in the lower tier vs. 5 billion bbl in the upper-tier OPEC countries.
These extreme differences do not necessarily imply that the reserves values are flawed; just that different standards are used in estimating the reserves. The Securities and Exchange Commission rules that are used to define proven reserves are not applicable to countries, only to oil companies. The oil companies in turn have to comply with the rules set up in the countries where they operate. For instance, tax rules in a country could encourage reporting low reserves, since amortization of investments is tied to the R/P ratio. On the other hand, during the 1980s many of the OPEC countries upped their "booked" reserves, in some cases by a factor of three, to position themselves in anticipation of a new quota system.6
The important issue, however, is that the relationship between discoveries and new oil production capacity needs to be standardized in order to quantify the true reserves and investments required to meet our future demand. Our preference is that the lower tier trend be used since it errs on the side of conservatism rather than excess. The derived algorithm for the lower tier is:
Pmax = 180 R
Pmax is production capacity expressed in barrels per day, and R is the new reserves, in million barrels of oil. As a rule of thumb, 600 million bbl of new reserves will generate 100,000 b/d of new oil production capacity.
At current world oil production rates, 25 billion bbl of oil reserves is consumed each year and will have to be replaced just to maintain the existing production rate. EIA forecasts future world oil demand will increase at an average rate of 1.7 million b/d/year. Generation of this new production would require (using Equation 1) finding an additional 10 billion bbl of new reserves each year. As a result, world reserves would have to grow annually by 35 billion bbl of oil, of which roughly three fourths goes to production replacement and the remainder to give an incremental jump in the production rate.
In its recent World Petroleum Trends report, IHS Energy's assessment of 1993-2002 states that "137 billion bbl of new oil discoveries were added. The combination of reserves revisions and new discoveries has exceeded global liquids consumption during the past 10 years."
Of the 137 billion bbl discovered, 33 billion bbl (estimated with Equation 1) went towards generating 6 million b/d of new oil production. Production grew from 60 million b/d to 66 million b/d over the 10-year period. The remaining 104 billion bbl of discovered reserves contributed partially to meet the 230 billion bbl required to replace production in existing fields. Reserves revisions during the 10-year period made up the difference and amounted to a hefty 126 billion bbl of oil.
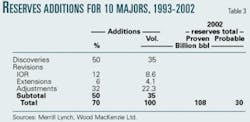
Revisions include reserves obtained by improved oil recovery(IOR), pool extensions from infill and stepout drilling, and adjustments for improved technology in existing fields, field micromanagement, and oil prices.7999999999999997 A breakdown of the distribution of the entire package of reserves additions (discoveries plus revisions) for 10 major oil companies from 1993 through 2002 is shown in Table 3. Reserves additions that amount to 70 billion bbl are split 50:50 between discoveries and revisions. IOR provides 12%, extensions 6%, and adjustments one third of the total reserves additions. The 10 major oil companies together generated an average of 7 billion bbl/year of reserves growth over the 10-year period.
Probable reserves
Reserves are classified into three categories: proven, probable, and possible. In simple terms, proven refers to reserves recoverable with present technology and prices; probable reserves are those subject to development if determined commercially viable; and possible reserves are those still highly speculative in quantity and viability. Probable reserves are sometimes referred to as technical reserves. The countries of the former Soviet Union, to encompass proved, probable, and possible reserves, use an additional category of "explored reserves."
It has been proposed that a better measure of a company's resource base would be a combination of proven and probable (P+P) reserves. The SEC imposes stringent restrictions on the commitment of capital based on proven reserves. In recent years, most large new E&P projects, especially those in deepwater regions, got the industry's go-ahead based on P+P reserves. It is difficult to justify capital for these high-cost projects based only on proven reserves.
SEC remains concerned about companies that book probable reserves, given the obvious risks that they may not materialize during the lifetime of the project. Qatar is a good example of this dilemma. It has 47 billion bbl of probable reserves (Table 2) associated with a potentially large E&P project, the well-known North field. These reserves are well-audited but can be classified only as probable. The country's proven reserves are 15 billion bbl.
From the data presented in Table 2, combining P+P reserves would increase the world's current resource base by roughly one third. Table 3 shows a similar percentage increase for the resource base of the 10 major oil companies.
Summing up
To sum up the current energy dilemma:
- EIA's energy demand forecast requires increasing world oil production rates by 40 million b/d by 2020. This production growth would require adding more than 35 billion bbl/year of oil reserves, averaged over the forecast period.
- E&P capital expenditures needed to meet the projected production goals would be $200 billion/year.
- A simple algorithm (Equation 1) was developed to estimate the volumes of discoveries required to generate new oil production. Using this algorithm, it is estimated that to generate the 40 million b/d increase in oil production would entail finding 10 billion bbl/ year of new reserves each year.
- Total reserves to be added each year consists of 10 billion bbl of discoveries plus 25 billion bbl from revisions of reserves to replace production in existing fields. Revisions comprise IOR, extensions, and adjustments for improved technology, field micromanagement, and oil prices.
- There is a critical need to connect demand and supply projections that at this time are done almost independently. The large volumes of reserves and capital required to meet future oil demand far exceed what we have done in the past.
Can we find these significant amounts of oil or substitutes to attenuate the natural depletion of this valuable resource? Will finding and development costs skyrocket as oil resources inevitably become scarcer? Are higher oil prices unavoidable?
Acknowledgment
My thanks to the Merrill Lynch Energy Team-London for providing valuable data and stimulating discussions on the theme of this study. F
References
1. Merrill Lynch Energy Team, "Higher Sustained Oil Price Now Recognized Reality," research report, Apr. 14, 2004.
2. Oil & Gas Journal, Worldwide Report, Dec. 22, 2003, p. 43.
3. Campbell, Colin, The Essence of Oil and Gas Depletion, Multi Science Publishing Co., 2002.
4. US Energy Information Administration, International Energy Outlook, March 2002.
5. US Geological Survey, "Uranium, Its Impact on the National and Global Energy Mix," USGS Circular 1141, 1997.
6. Sandrea, Rafael, "OPEC's Challenge: Rethinking its Quota System," Oil & Gas Journal, July 28, 2003, p. 31.
7. Williams, Bob, "Progress in IOR technology, economics deemed critical to staving off world's oil production peak," Oil & Gas Journal, Aug. 4, 2003, p. 18.
This is the first in a series of four articles revisiting the debate over Hubbert's Peak.
The author
Rafael Sandrea (rafael@ its.com.ve) is president and CEO of ITS Servicios Técnicos, a Caracas-based engineering company he founded 28 years ago. He holds a PhD in petroleum engineering from Penn State University and has written more that 25 technical publications, including the book Dynamics of Petroleum Reservoirs under Gas Injection, Gulf Publishing, 1974.
